Could you see it?
Hey team, US stocks traded broadly lower on Friday and for the week, as investors reacted to a new tariff on auto imports and another rise in inflation expectations.
Let’s recap Friday’s session, review all the data points we were watching before the sell-off, and see what’s ahead for the market!
Impact Snapshot
ISM Manufacturing PMI - Tuesday
JOLTS Job Openings - Tuesday
ADP Non-Farm Employment - Wednesday
Trump’s reciprocal tariff announcement - Wednesday
Unemployment Claims - Thursday
Non-Farm Payrolls - Friday
Unemployment Rate - Friday
Macro Viewpoint
The S&P 500 Index fell 1.5% this week, wiping out the previous week's gain amid worries about additional tariffs and worsening consumer sentiment.
Data released Friday showed a smaller-than-expected rise in February consumer spending, while the Federal Reserve's preferred inflation metric unexpectedly accelerated.
The start of April will bring two key policy shifts: the announcement of reciprocal tariffs and the tapering of Fed quantitative tightening.
Could you see it?
A great deal of why we are able to figure out what the market is doing hours or days before the fact is by fusing technicals and macro to get a comprehensive sentiment.
Everyone is good at LARPing knowledge and hitting that replay button, saying why they “think” the market pulled back on Friday. If you run a poll in a room of traders, the majority will tell you “it was the PCE number.”
Well, guess what? There was no PCE number at 6:00 AM when we wrote this post.
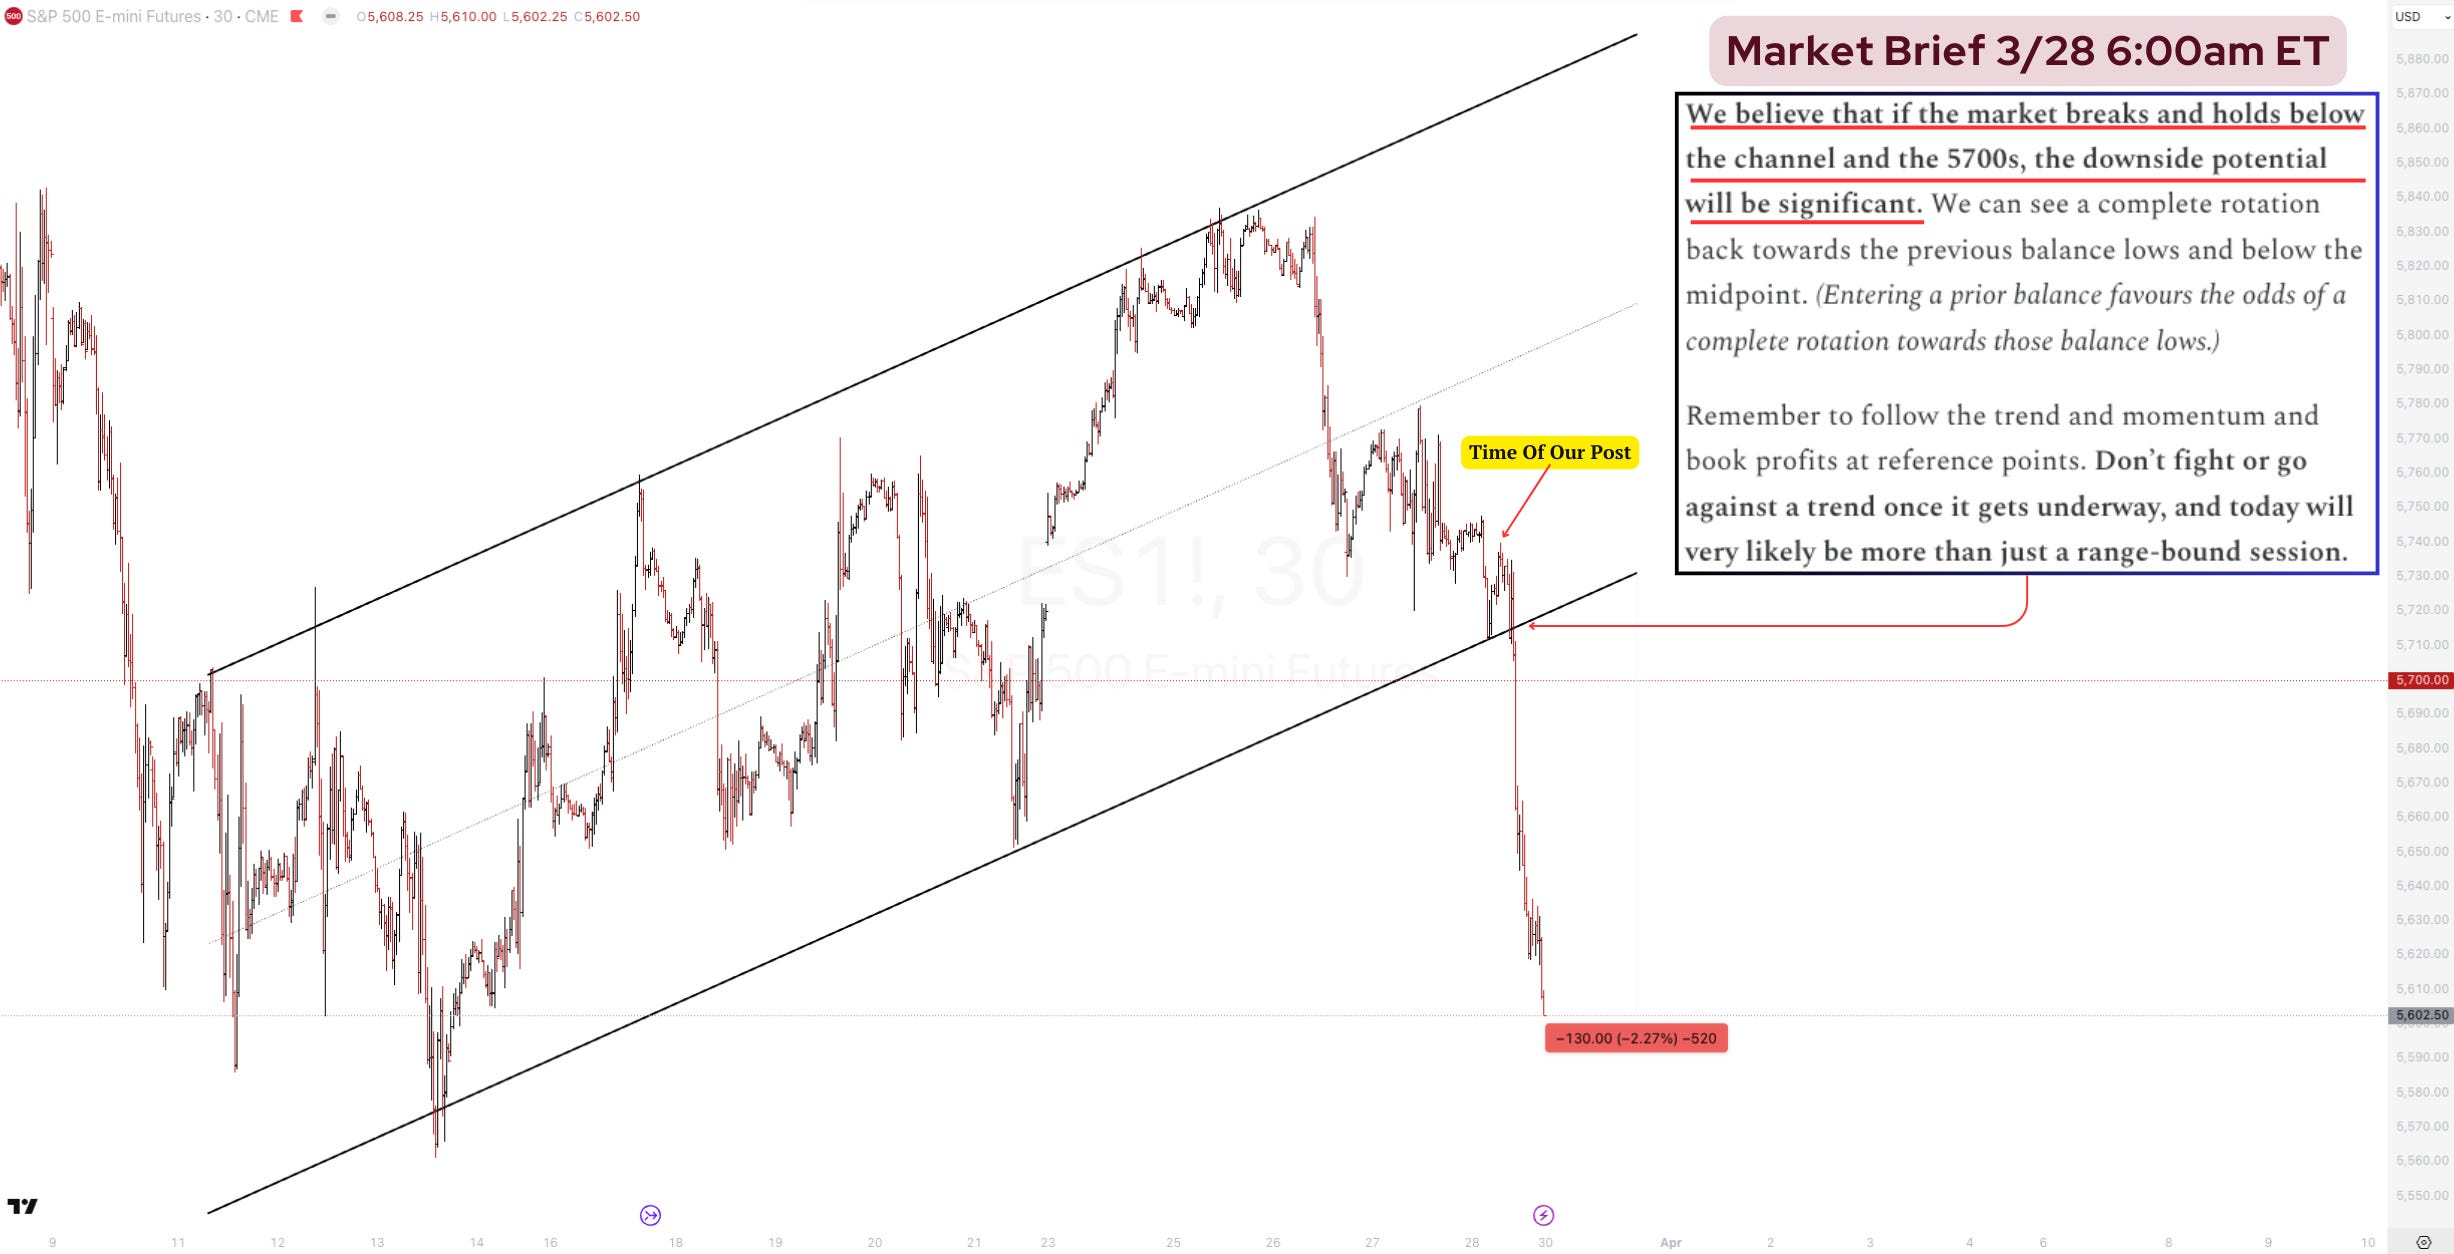
Read word for word what we shared in the image above with our subscribers during our overnight market brief before any news or economic releases could have hit, to warn them about the potential of a significant drawdown.
What type of day is it likely to be?
The real money in trading is figuring out this question as early as possible during the session: Is it likely going to be range-bound or a trend day?
If you misinterpret this question and thought the market would remain in a range-bound formation on Friday, your account would probably not exist right now.
All the evidence we had at 6:00 AM suggested that the market was gearing up for a significant move, which is what we communicated through our market brief before any sentiment or economic releases could have hit, and we warned to NOT stand in front of it.
Price action leads the news because it is the most direct and immediate reflection of market sentiment.
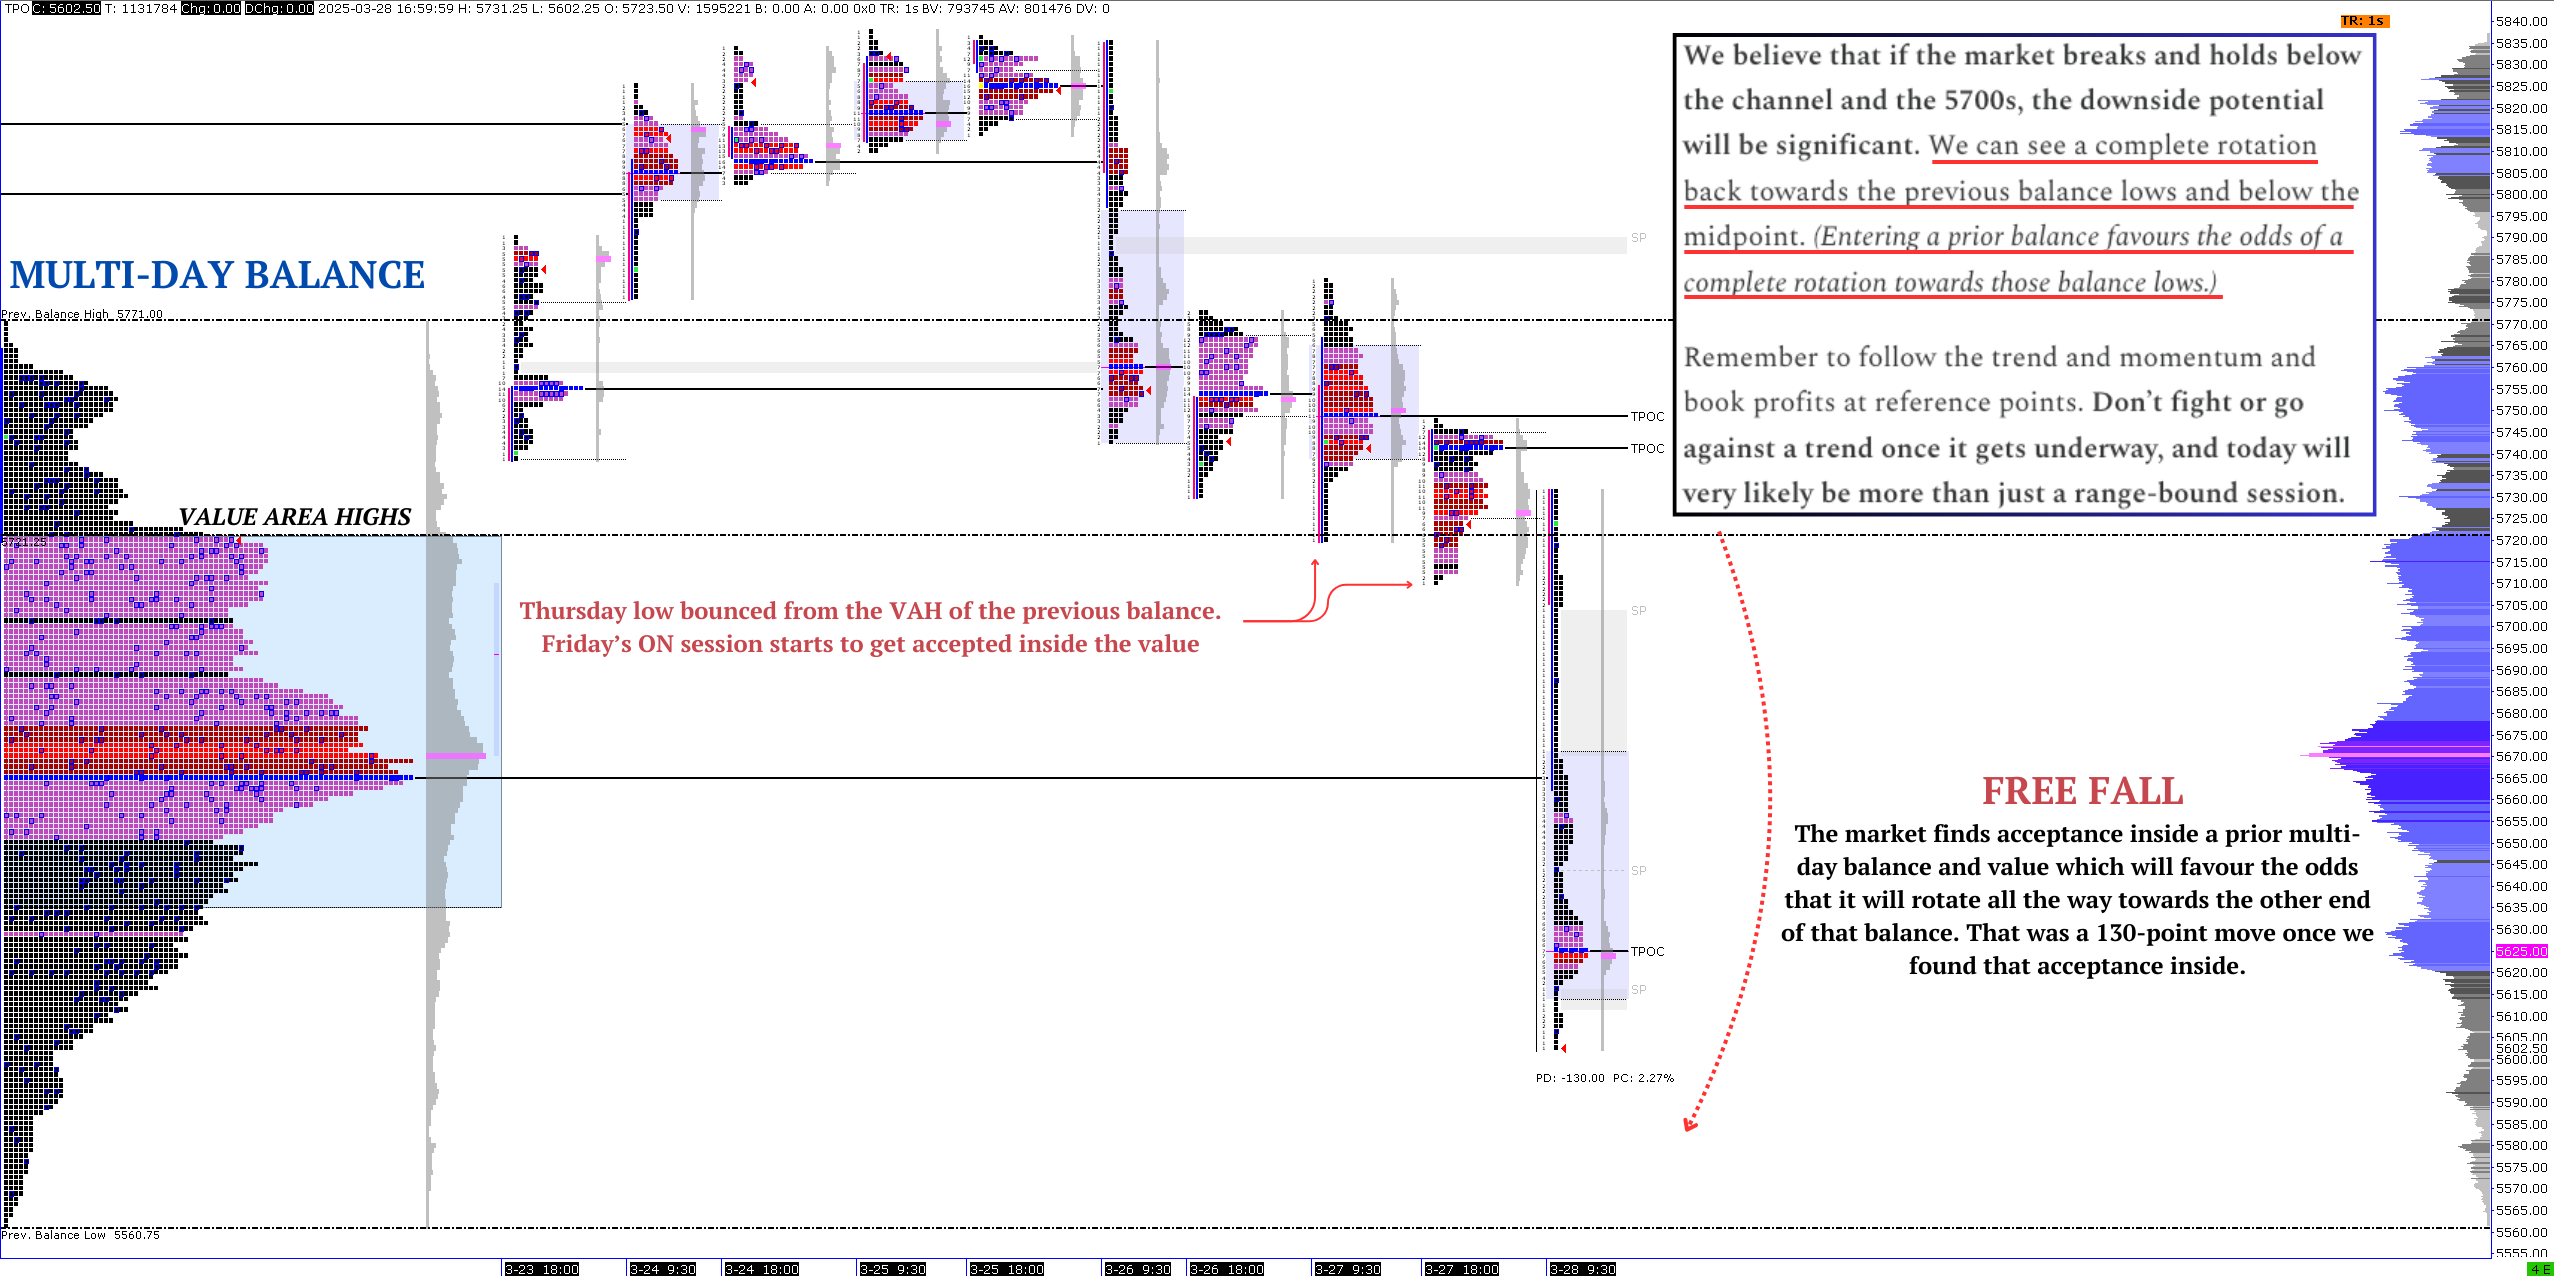
Same context, but now visualizing it on the market profiles above.
The best way to describe an entrance back into a previous multi-day balance range is to think of it as a gravitational field that will pull price back and forth, with the midpoint acting as a profit-taking zone.
Now, think of entering that gravitational pull (e.g., value area highs). Where is the most likely destination for the market?
A complete rotation toward the other end of that balance/range/distribution that you see on the chart above.
Wall St. Prime Intel
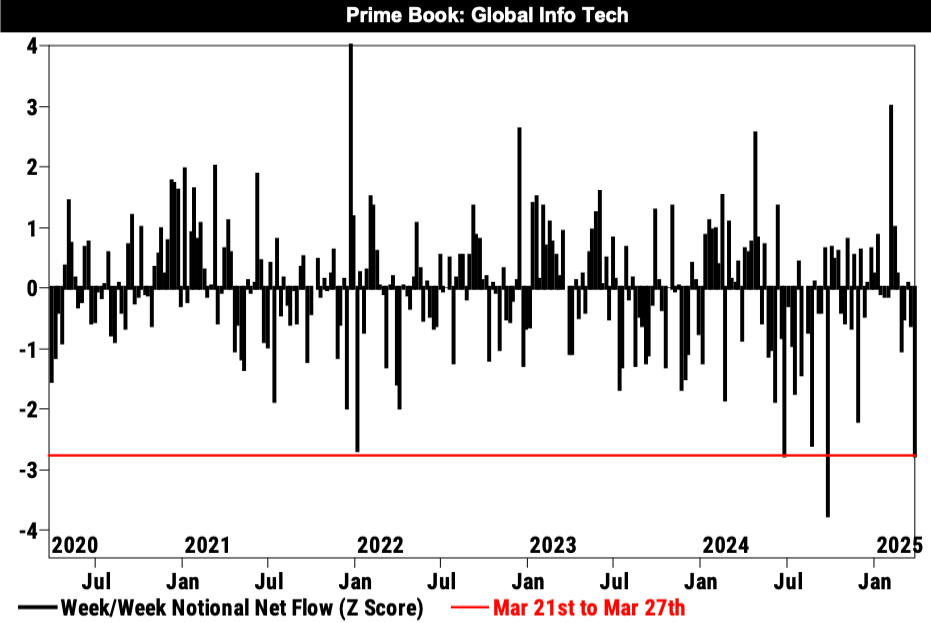
Hedge funds net sold global Info Tech stocks across all regions this week and at the fastest pace in 6 months.
HFs net sold Info Tech stocks across all regions this week, led by US names that made up ~75% of the notional net selling. This week’s notional net selling in global Info Tech was the largest in 6 months and the second largest in the past 5 years.
Info Tech was among the worst performing global sectors and by far the most net sold on the Prime book this week, driven by long-and-short sales (2 to 1).
In our weekly Wall St. Prime Intel research, we discuss positioning, flows, and observations across the floors of major investment banks.
Read the full report by Subscribing below!👇