
Emotional Week Ahead
Hey team.
We’re back with another report sharing insights of the market. Let’s recap last week and see what’s next!
Impact Snapshot
Services/ Manufacturing PMI - Wednesday
Q2 GDP - Thursday
Unemployment Claims - Thursday
PCE Inflation - Friday
Consumer Sentiment - Friday
Earnings: TSLA 0.00%↑ GOOGL 0.00%↑ IBM 0.00%↑ KO 0.00%↑ VZ 0.00%↑
Market Evaluation
As earnings season goes into full swing, bullish investors are optimistic that strong corporate results will halt the decline in technology shares, which has driven this year’s U.S. stock rally.
During the first half of the year, as the S&P 500 continuously hit new records, some on Wall Street grew concerned that the rally was primarily driven by a few technology giants, with limited participation from other sectors.
The technology sector has plunged nearly 6% in just over a week, losing about $900 billion in market value.
This decline is driven by increasing expectations of interest rate cuts, which are diverting money away from this year’s winners and into sectors that have underperformed in 2024.
Historically, interest-rate cuts have ushered in strong stock-market returns but only for cycles that aren’t triggered by a recession, like this one.
Economic data on focus will include Q2 gross domestic product and the June personal consumption expenditures index, a closely watched inflation measure.
Markets Breakdown
Last Wednesday, we experienced a day focused more on sector rotations, while Thursday and Friday saw a broader market sell-off.
A key observation of the sell off was that it was not characterised by overly emotional or panic-driven selling.
There is a significant difference between profit-taking in the tech sector, which is primarily driven by four major stocks and constitutes 32% of the S&P, and a full-blown panic selloff.
Technology got ahead of itself, which was a key focus point of this very “narrow” driven rally and pulled away from other sectors by a lot.
Carry this information forward and remember the key thing we keep saying for months, you’ll know the lasting ATH well after the fact.
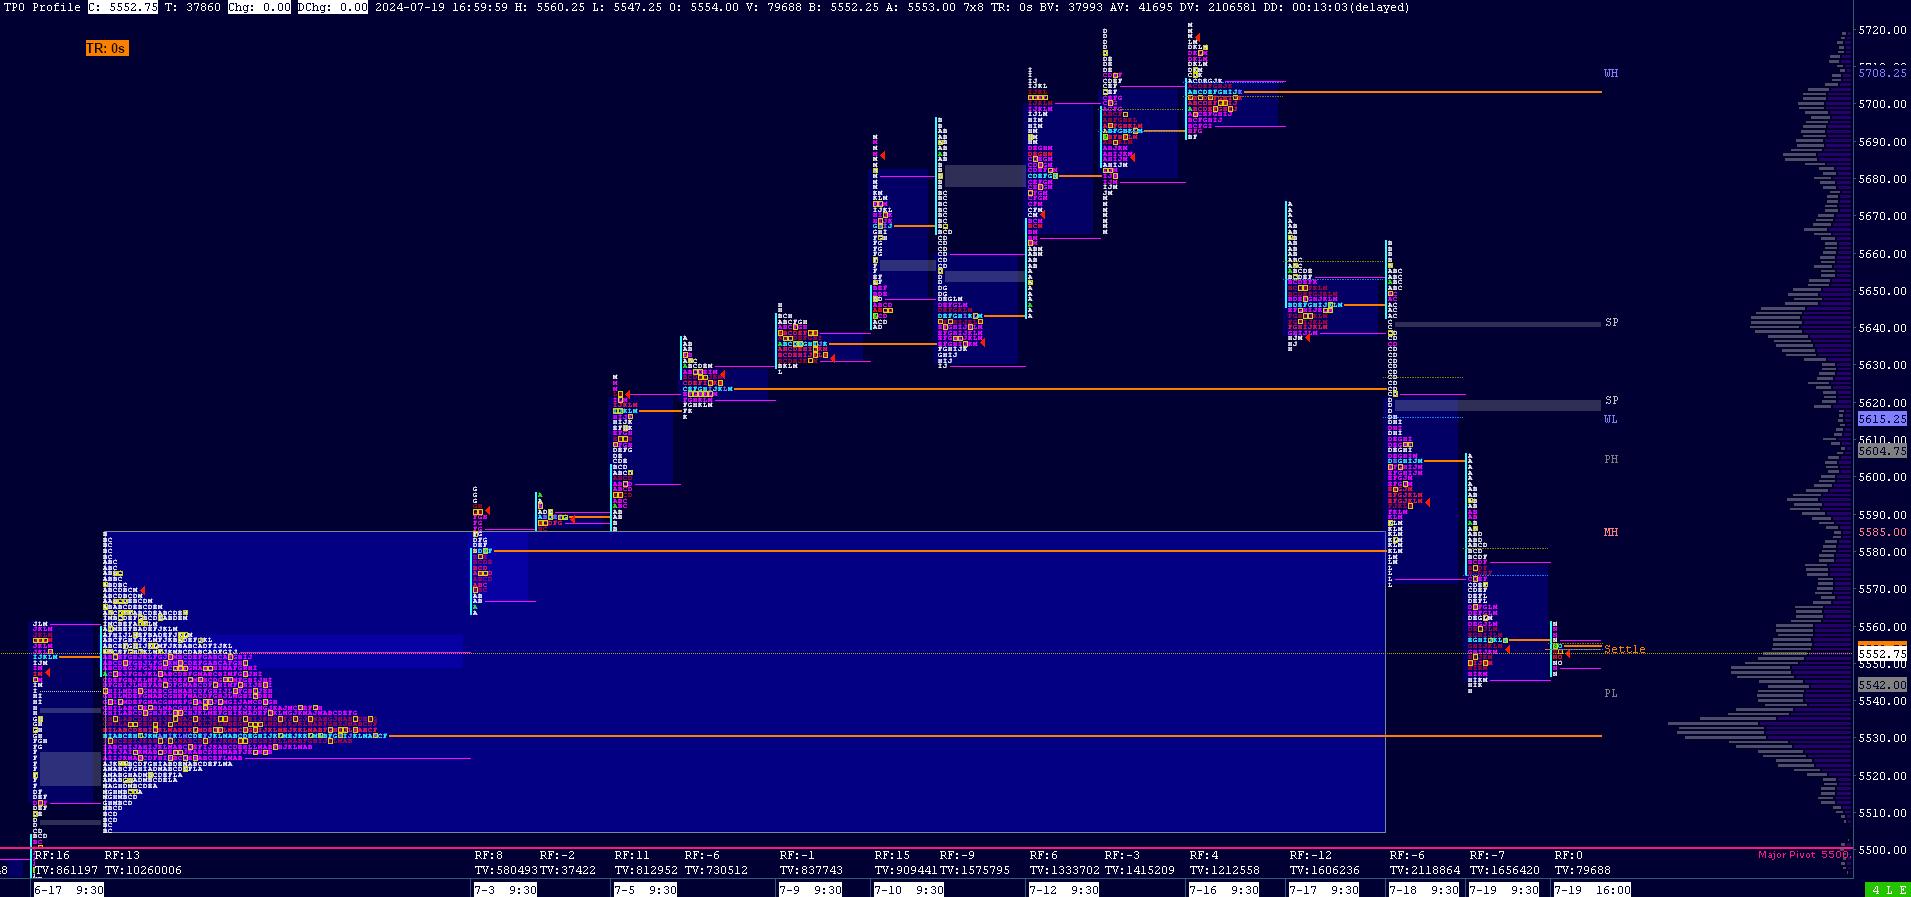
Getting technical, market does one thing: It goes from a state of balance to imbalance and back into balance.
When the market is in an imbalance state, which is what we’re currently experiencing, it’s doing price exploration and all the market is trying to do is finding new levels and a balance range where it can be efficient again.
A market that is moving fast in either direction is not an efficient market.
The chart above is showing a composite of the last range that this market has been on a balance state. Get this exact chart layout here
Entering a prior balance and finding acceptance inside, usually leads to a rotation on the other end of that balance. This area will be the main focus.
The make or break level for this whole week will be containing activity above 5500 and we will observe how does the market act if it comes down to that area.
Heading into next week, we’re likely going to get some emotional reaction over the geopolitical events that occurred over the weekend surrounding the US elections.
Although there is a great amount of uncertainty as to what the market is going to do when a key catalyst hit, we are still looking at the same areas to participate in the market.
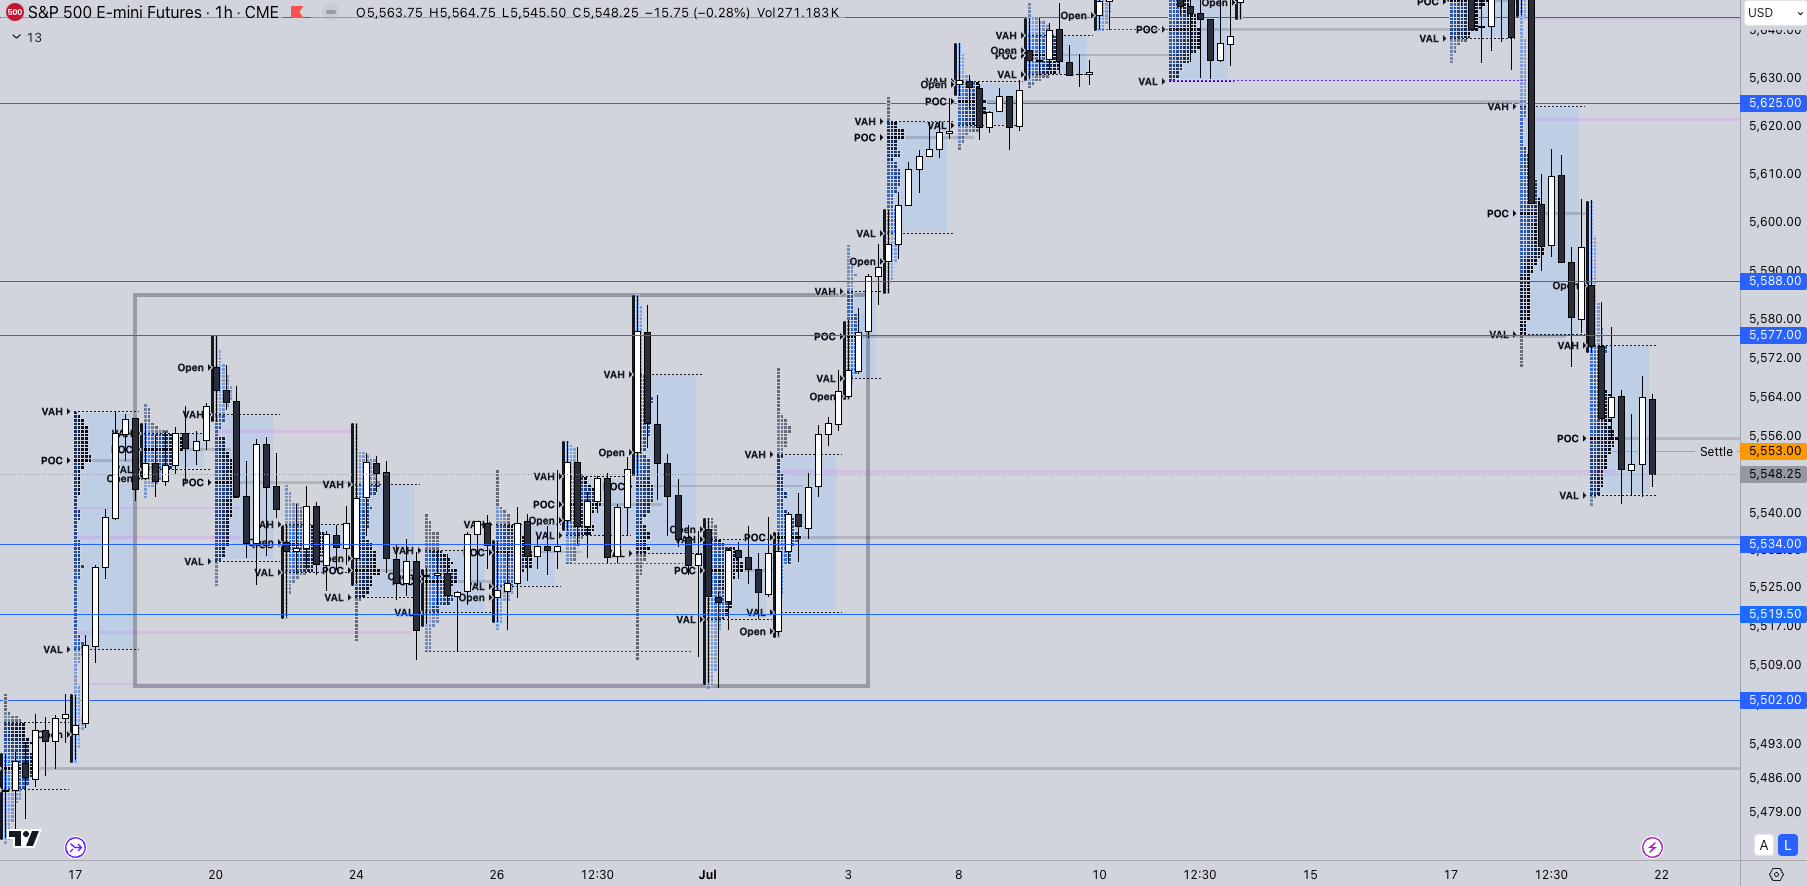
ES
Some references we’ll be looking going forward:
Upside Levels: 5577/5588/5625
Downside Levels: 5534/5519/5502
That’s all we got!
Like this post, share it with a friend.
Oh… here’s some incredible QuantVue Pro Member results from this week:


We’ll see you again on the next one!
Want our premium TradingView & NinjaTrader tools?
Disclaimer: Futures and options trading carries a significant level of risk and may lead to substantial financial losses. The content provided in this newsletter is solely for informational purposes and should not be construed as a trade recommendation or financial advice. It is essential for readers to independently assess and make their own investment decisions, taking into consideration their personal financial situation and risk tolerance.