Free fall
Hey team, today's report covers our recent market analysis following the U.S. presidential election and the price developments over the past two weeks.
Let's recap the recent price action and provide a practical example of how to interpret "value" within your narrative.
Impact Snapshot
NVDA 0.00%↑ Earnings - Wednesday
Unemployment Claims - Thursday
Manufacturing / Services PMI - Friday
Consumer Sentiment - Friday
Macro Viewpoint
The S&P 500 index dropped 2.1% this week as robust retail sales data and remarks from Federal Reserve Chair Jerome Powell dampened hopes for a rate cut in December.
Despite this week’s decline, the S&P 500 index remains up 2.9% for the month, buoyed by last week's rally driven by the U.S. presidential election results and a 25-basis-point rate cut from the Federal Reserve.
On Friday, data revealed that U.S. retail sales in October exceeded expectations, spurred by a significant rise in auto purchases, with September’s figures also revised higher.
This strong retail report further reduced the likelihood of another Fed rate cut, particularly after Fed Chair Jerome Powell stated a day earlier, “the economy is not sending any signals that we need to be in a hurry to lower rates.”
Gaps and Low volume
If you ask 100 traders why a move happened, you will likely get 100 different answers. The reality is that most retail traders have no idea why the financial markets they trade even move.
In these Sunday articles and our daily market brief, we like to explain things with charts and recurring market-generated information that the market is communicating through its two-way auction process.
Your ability—or lack thereof—to understand that an actionable market is no different than an auction to sell a painting or a car will drastically change your perspective on price and value.
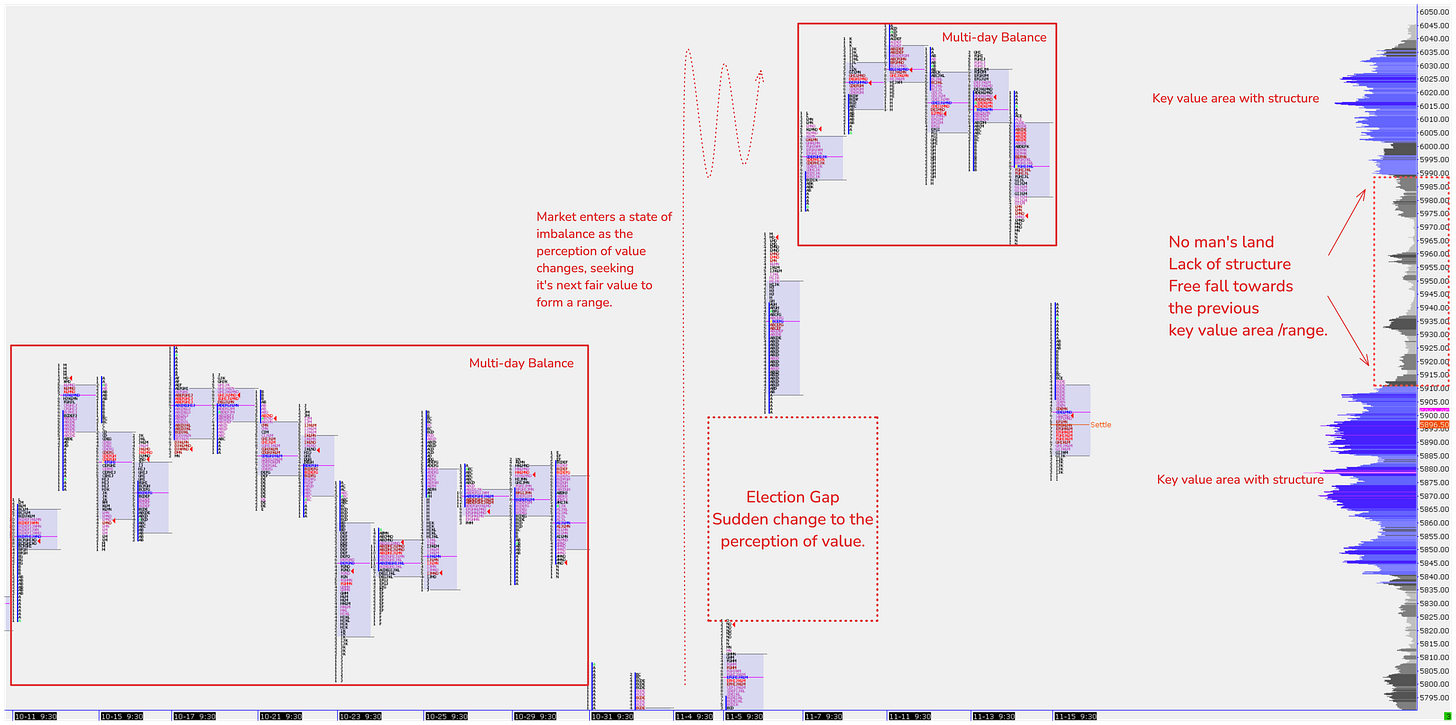
In our Thursday market brief, we highlighted the market’s two key value areas and a “no-man’s land” zone, which underscored an extreme low-volume area paired with a gap.
High-volume nodes are where buyers and sellers agreed on prices and conducted two-way trading, forming a proper market structure, while low volume indicates a disagreement, and the market doesn’t like staying in these areas for long periods of time.
When the market experiences a sudden directional move to either the upside or downside, which can be an imbalanced state spanning 2-3 days, there is no structure to that move. Once the price returns to it, it will likely fall right through, as there is no support for that structure.
The market will always seek to trade at the fairest price, and once you enter a “void” of price, such as a gap or low-volume area, you will likely fall right through it and land on a previous “fair value”/ balance range.
Practical example of Fair value
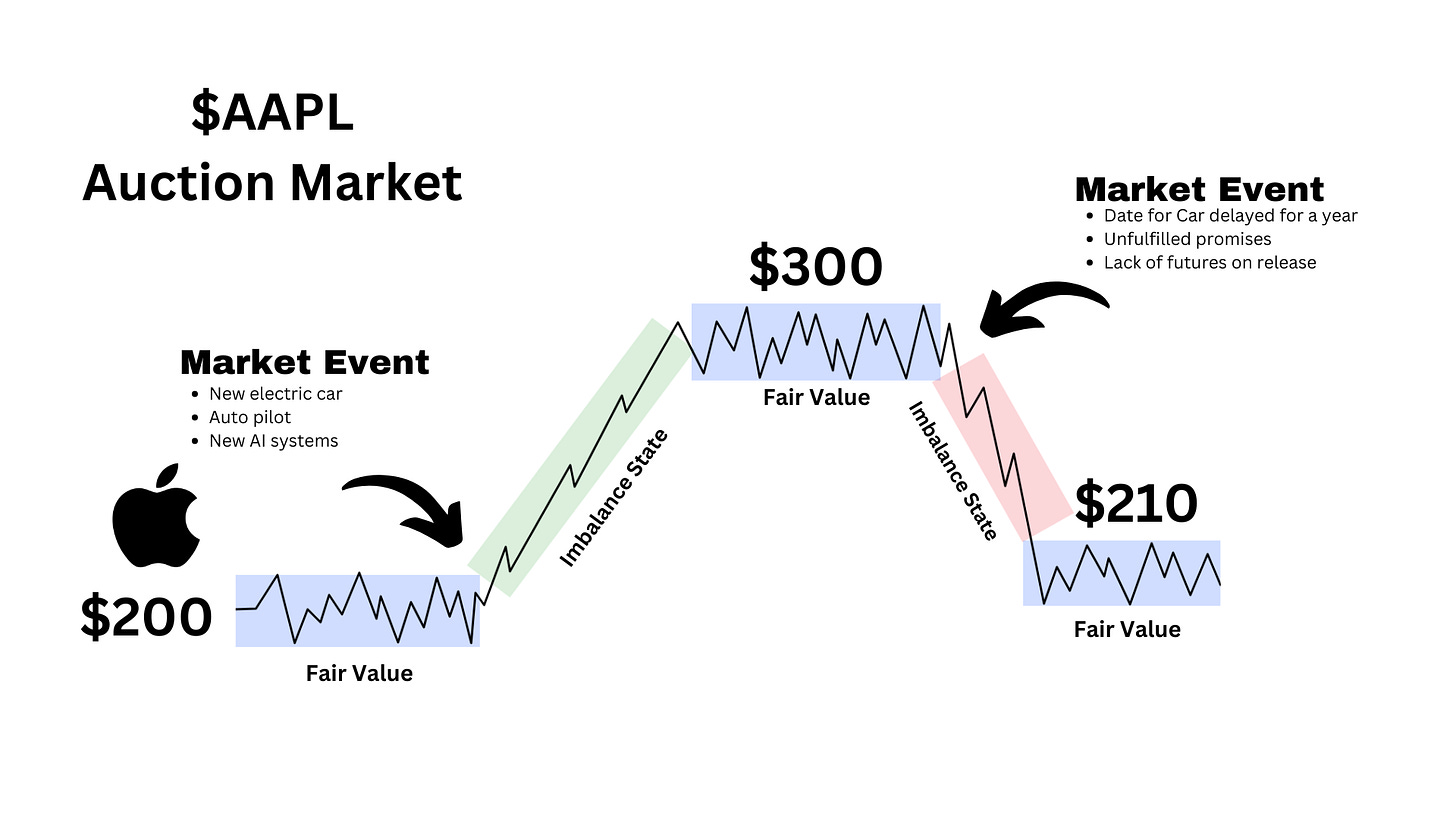
Imagine Apple (AAPL) stock is trading steadily at around ~$200, a level considered its fair value. The stock has been relatively stable at this price, suggesting that market participants — buyers and sellers — are in a state of balance.
Then, at its next major event, Apple makes a groundbreaking announcement: the company is developing an innovative electric car featuring advanced AI capabilities, self-driving technology, and a sleek, futuristic design.
The excitement among investors is immediate. The news drives a wave of buying activity, and the market becomes imbalanced as demand surges. AAPL stock quickly rallies, rising to ~$300 as traders search for a new fair value that reflects the potential of Apple's expansion into the electric vehicle market.
For the next several days, the stock trades in a range near ~$300 as market participants evaluate and adjust to the new information.
However, two weeks later, Tim Cook, Apple’s CEO, gives an interview about the highly anticipated electric car. Unfortunately, instead of reinforcing the market's enthusiasm, he reveals that the project is facing significant delays and that some of the initially promised features may not be ready at launch.
The news disappoints investors, casting doubt on the timeline and execution of Apple’s new venture.
This revelation disrupts the market once again, sending AAPL stock into another imbalance as disappointed traders rush to sell.
The price starts to decline, retracing much of the previous gains as there was significant lack of underlying support from the initial wave of buying, and eventually settles all the way back near the prior fair value region around ~$210, where buyers and sellers find equilibrium once more.
The same process occurs with any financial instrument you trade. Catalysts like economic reports, such as inflation data, drive the market between states of balance and imbalance. When a report is released, it can disrupt the equilibrium, causing prices to search for a new fair value as traders react and adjust to the new information.


