
how to trade this market puke
Evening traders.
We’ve had quite the selloff across the board this week, with the bears tightening their grip.
But can they hang on? Or will the bulls take back the reins?
We break it down and share the levels we’ll be trading.
Let’s jump in!
Impact Snapshot
Unemployment filings remain stable, indicating the labor market's resilience.
Fed’s Williams suggests a rate hike isn't the primary option, though still possible if necessary.
Market Evaluation
The S&P 500 slipped for a fifth straight day on Thursday, registering its longest losing streak since last October
Strong economic indicators and a hawkish tone from Federal Reserve officials further fueled expectations that interest rates will remain elevated for an extended period.
Unemployment filings stayed low, reflecting a bobust job market. Additionally, the Philadelphia Fed factory index surpassed expectations.
Despite a decline in existing-home sales, the rate of decrease aligned closely with economists' median predictions.
Sierra Chart Suite
When the market is approaching a key point of reference that we share on our daily market plans, we like to monitor order flow for clues of continuation or the lack of.
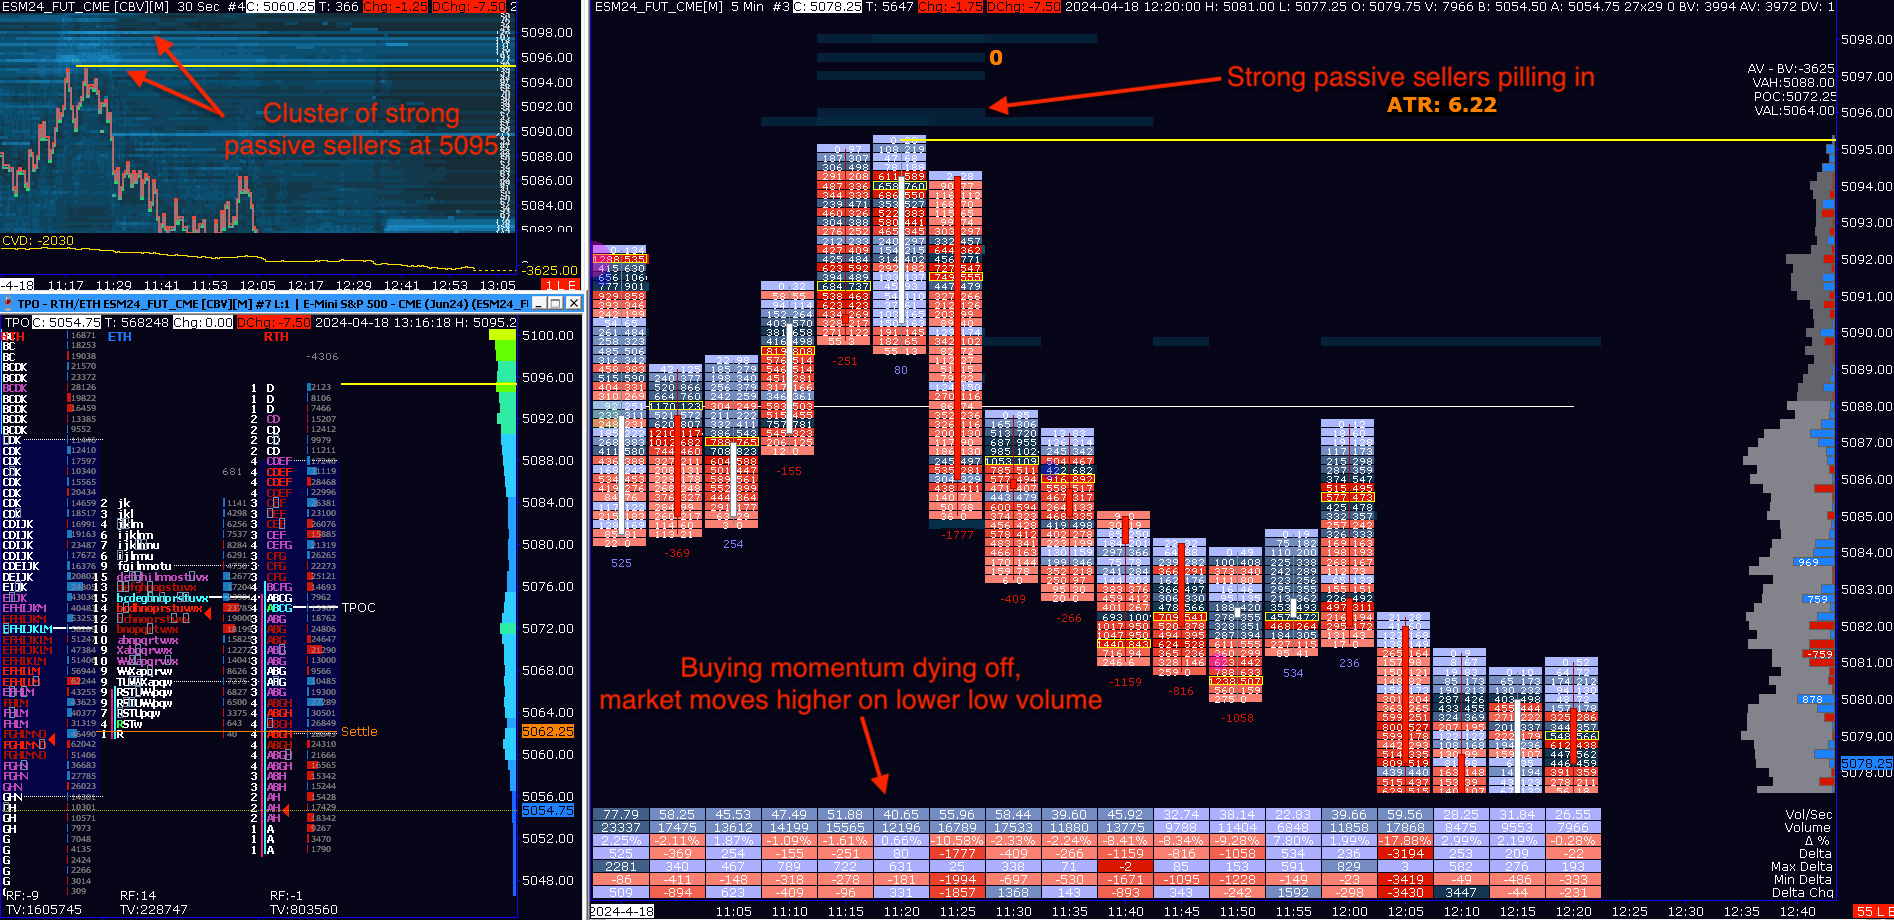
Our key reference to the upside was 5095 that we’ve shared prior to the US market open over on X here.
Going long at 5095 which was a key resistance zone, with no confirmation of a "break and hold above" that would signal acceptance, was a high risk move.
In this instance, we can see positive deltas at the highs, both on the side delta profile as well as foot print that were met with strong passive sellers.
This was an indication that we had trapped longs with no momentum to breakout from this key zone that were easily shaken out the moment the market started to break.
Markets Breakdown
The upside pivot of 5095 halted buyers early attempt to find acceptance above the critical 5100s, leading into another lower low relatively to yesterday.
We’ve been on a clear downtrend with market building value lower and lack of any significant buying activity.
It is not uncommon for the market to first break at least 5-10% before the longer term money start to get worried.
Investors make money by spending time in the market.
Traders make money by timing the market.
If the longer term investment money start to get shaken out, a more meaningful pullback with follow ahead. We have yet to see this activity take place.
Check how we caught the whole move with our QuantVue Toolkit here and provided live coverage updates on the replies.
ES
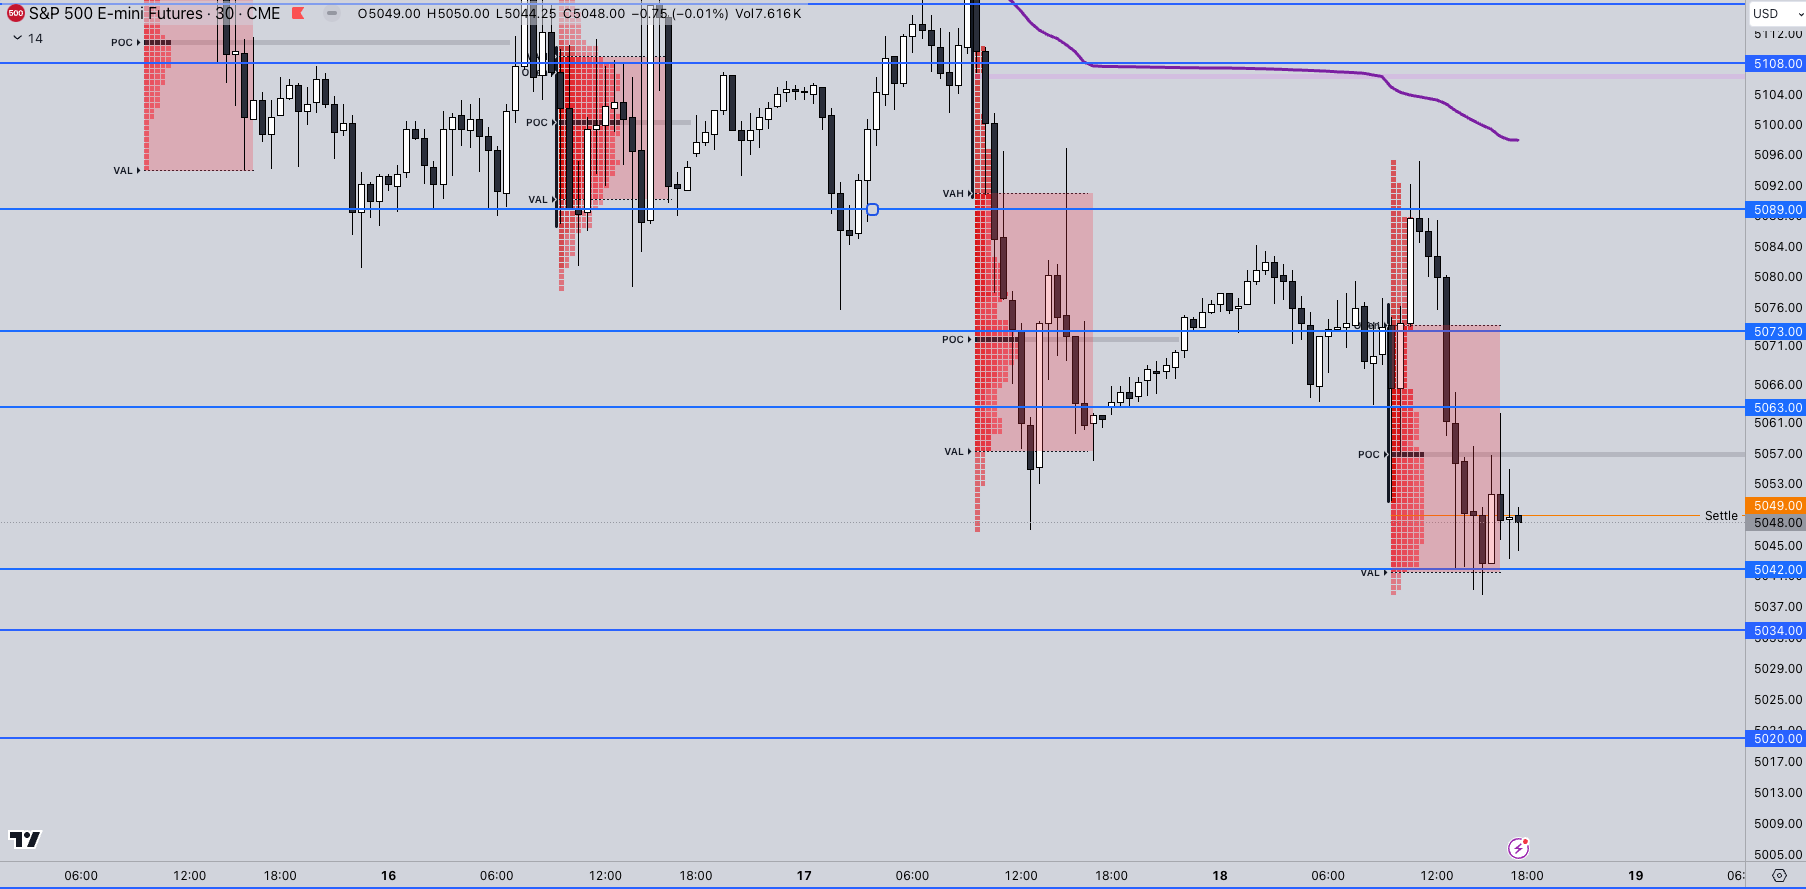
Some key references for navigating the overnight session going into Friday
Upside Levels: 5063/5073/5089
Downside Levels: 5042/5034/5020
That’s all we got!
Like this post, share it with a friend.
We’ll see you again on Sunday.
Oh, if you want access to our premium TradingView, NinjaTrader, or Sierra chart suite, go check them out on our website here.
Disclaimer: Futures and options trading carries a significant level of risk and may lead to substantial financial losses. The content provided in this newsletter is solely for informational purposes and should not be construed as a trade recommendation or financial advice. It is essential for readers to independently assess and make their own investment decisions, taking into consideration their personal financial situation and risk tolerance.