
The Market Brief
Hey team. U.S. equity indexes bounced back on Wednesday, buoyed by renewed optimism over easing trade frictions with China.
Let’s re-view yesterday’s session and see what’s ahead for this market!
Impact Snapshot
🟥 Interest Rates - 2:00pm
🟥 FOMC Press Conference - 2:30pm
Macro Viewpoint
We expect the FOMC to maintain the target range of 4.25% - 4.50% at today's meeting, with no policy changes or significant updates to the post-meeting statement.
We also expect the main message from Chair Powell’s press conference to be that the Committee is well positioned to wait for greater clarity before making any changes to policy.
Economically, the data so far mirror a sharper version of typical event-driven slowdowns: surveys have declined quickly—especially outlook expectations—while hard data, which usually take about three months to show real-time weakness, haven’t softened yet.
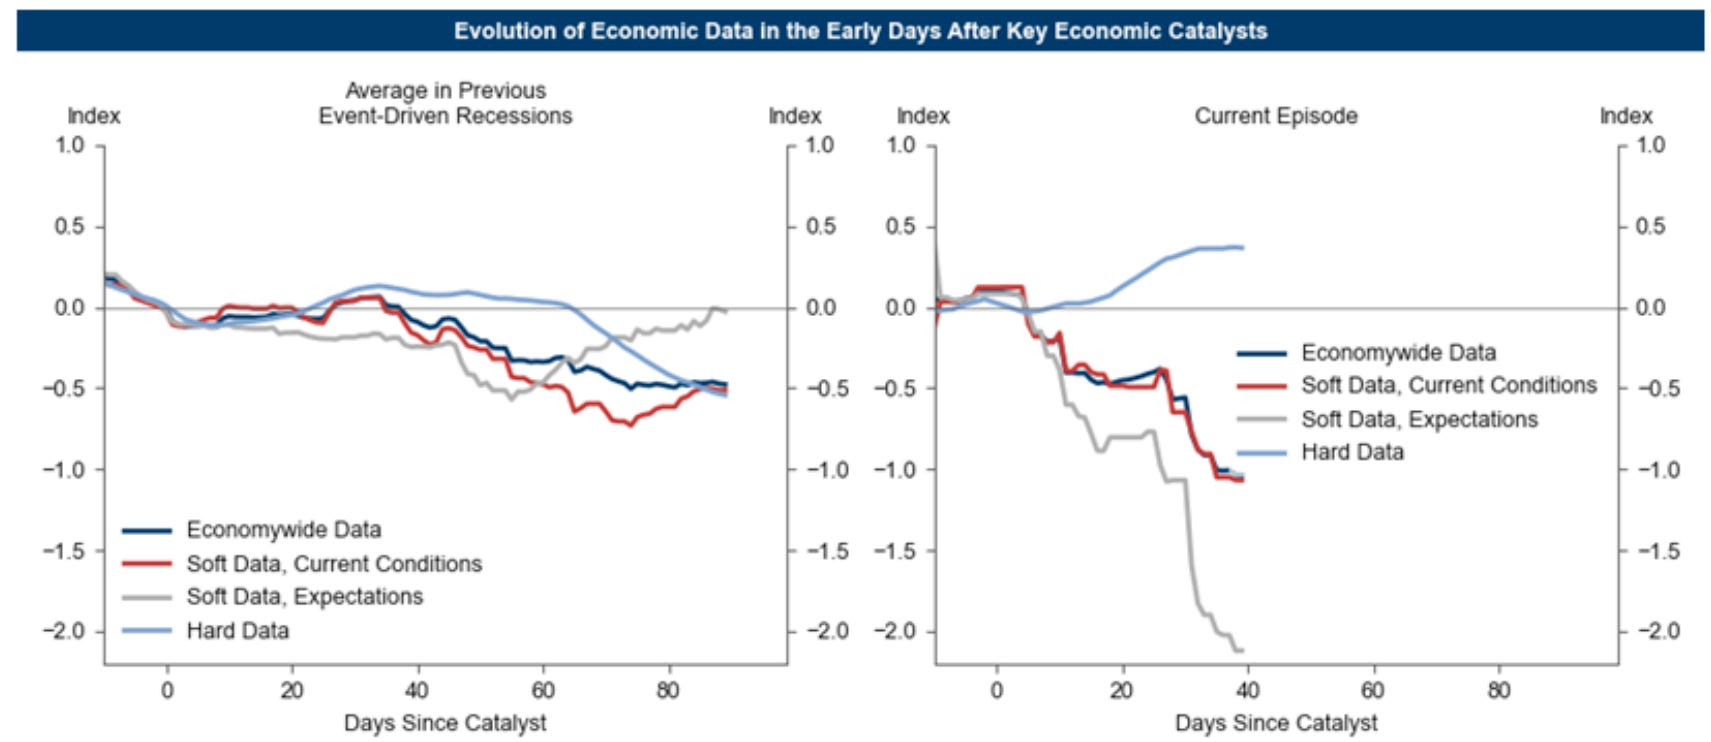
Fed officials, mindful of past false recession signals from surveys, will likely wait for labor market and other hard data before cutting rates.
Prior Session Deep Dive
You won’t believe the probabilistic edge you can gain over the competition once you internalize the concepts we cover in these deep-dive sessions on a daily basis and start recognizing the recurring structural patterns intuitively.
How could we possibly know two days before that the market was looking to come into short-term balance and form a range? Why did we warn about the risk associated with “piling up” on an extreme short overnight?
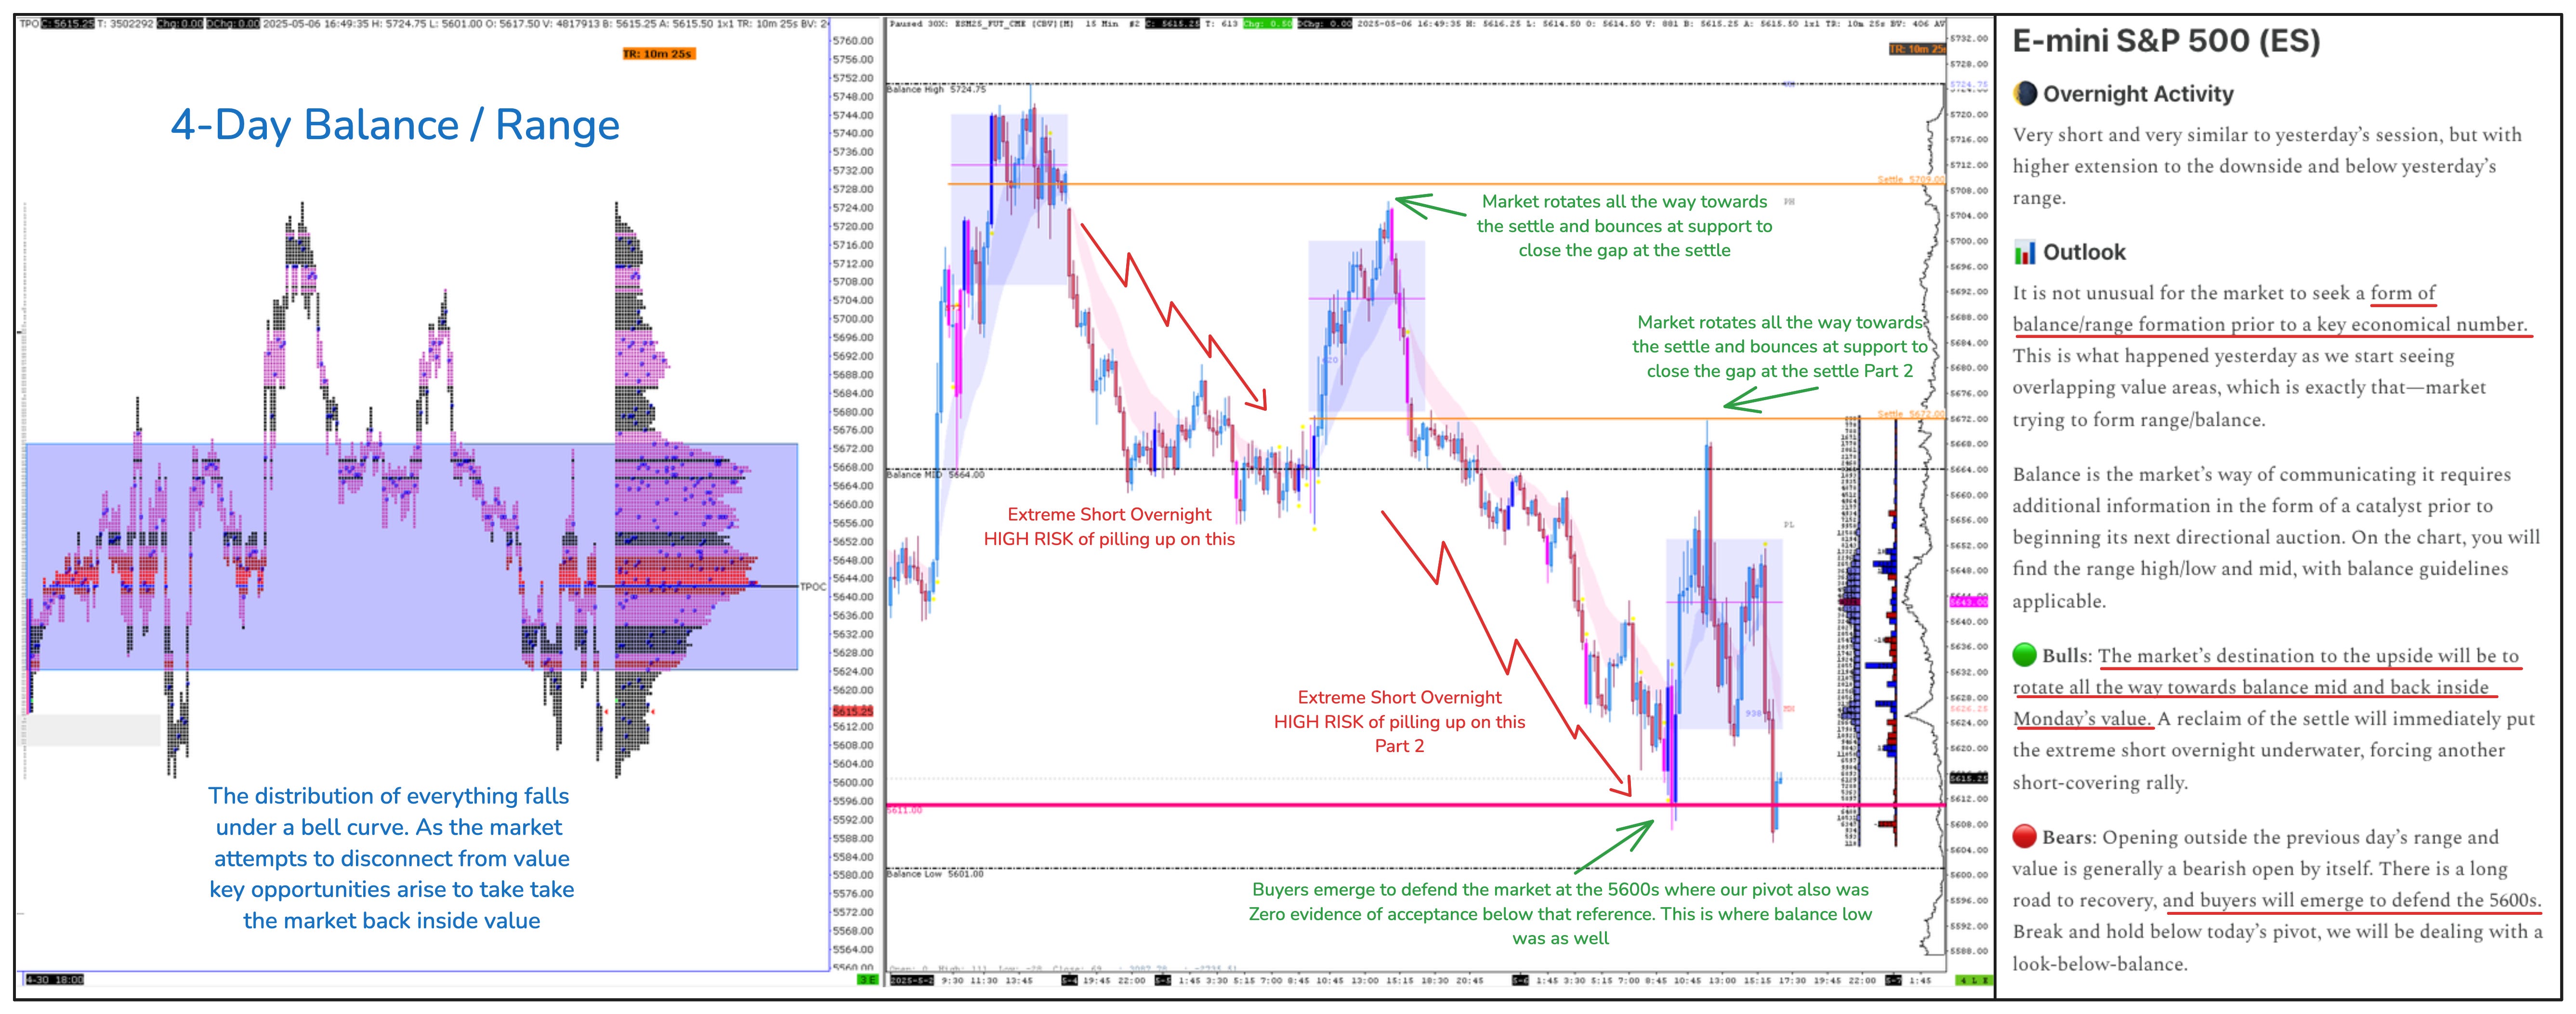
Historically, it’s uncommon to get back-to-back sessions that look exactly similar to each other. This was one of those occasions, and if you memorized any of the data points we shared in yesterday’s deep dive, you would have seen the same thing.
Quite literally, all the market did was bounce from support at our pivot at the U.S. open and get pulled back toward the midpoint of balance to close the gap at the settle reference to the tick. This was literally the same thing that happened on Monday.
Media noise
It’s easy to “larp knowledge” these days and pretend to “know” what’s going on in the markets. All you gotta do is find some guru-made strategy, attach yourself to that cult, open up youtube and start doodling on the chart after the fact something happened while yapping classic retail nonsense like “stop hunt, exit liquidity, it was the news”.

Grab a camera, make your way inside any investment banking trading floor and ask the dealers “why you guys hunt for our stops”. You won’t get an answer you expect but you sure as hell will record a lot of laughs.
Regulated markets have strict rules against market manipulation and large institutions face significant legal and financial risks if they employed even remotely some of your favourite’s lambo youtuber “institutional” concepts.
The SEC’s Securities Exchange Act / CFTC’s Commodity Exchange Act
Nobody is “hunting” for your stops on the regulated markets. More often than not, it’s poor risk management that leads to any trade being underwater — but of course, it’s easier to blame the “unknown” to a myth-made concept than to be honest with yourself.
This tendency to externalise blame to an “unknown force” rather than face uncomfortable truths is a psychological pattern that has persisted throughout human history for thousands of years.
Take Statistical Approach
We provide an ebook on our Paid Substack version which covers a lot of concepts around market profiling and order flow. Be assured there are no “cult-based” bullshit myths invention in there.
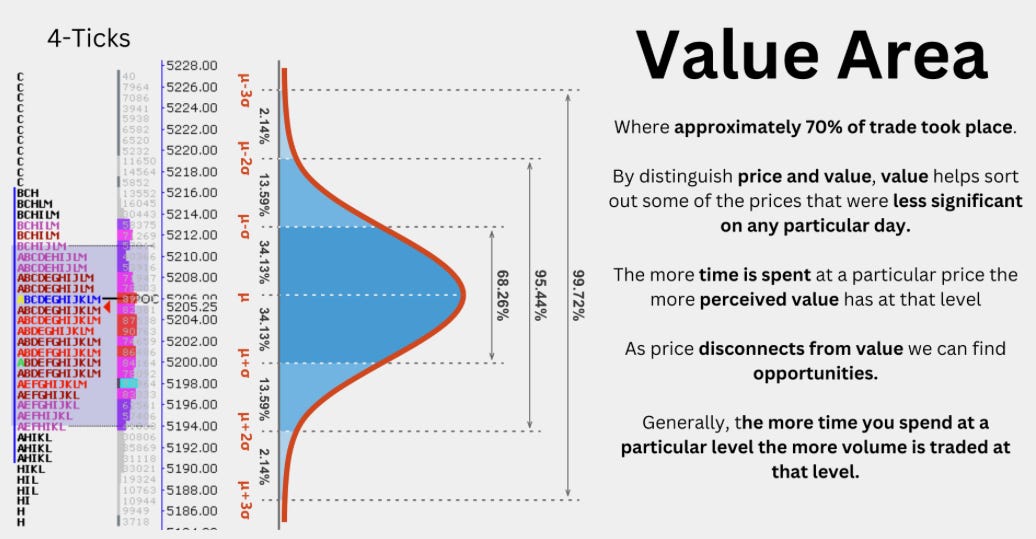
Scientists in any field employ “bell curves” to study and interpret data. By visualising the distribution of that data, you can get actionable information and understand the “herding” behaviour of market participants.
The Market Profile reveals signs that help market participants continuously enter and exit the market to better manage their risk.
This organisation of data allows us to observe developing market structure, much like watching the early formation of clouds. A thin, wispy cloud might suggest only light weather ahead, while a towering storm cloud hints at a coming storm. The shape and density of these early formations give us clues about what’s likely to unfold.
This statistical approach can significantly change your thought process and risk management once you understand where the market traded the most and where opportunities exist as you detach from fair value.

Develop better context and create a robust entry model by understanding all the market nuances we share on a daily basis. This will help you build the market understanding that most traders lack.