The Market Brief
US equity futures pushed higher Friday, led by a recovery in chipmakers, as investors looked past renewed Iran tensions and turned their attention to the morning's jobs report.
Impact Snapshot
🟥 Non-Farm Payrolls - 8:30am
🟥 Unemployment Rate - 8:30am
🟥 Consumer Sentiment - 10:00am
Macro Viewpoint
The fundamental backdrop has not materially shifted, but the optimism priced into equities may be approaching an inflection point as earnings season winds down and near-term catalysts thin out. Today’s April nonfarm payrolls print carries added weight in that context.
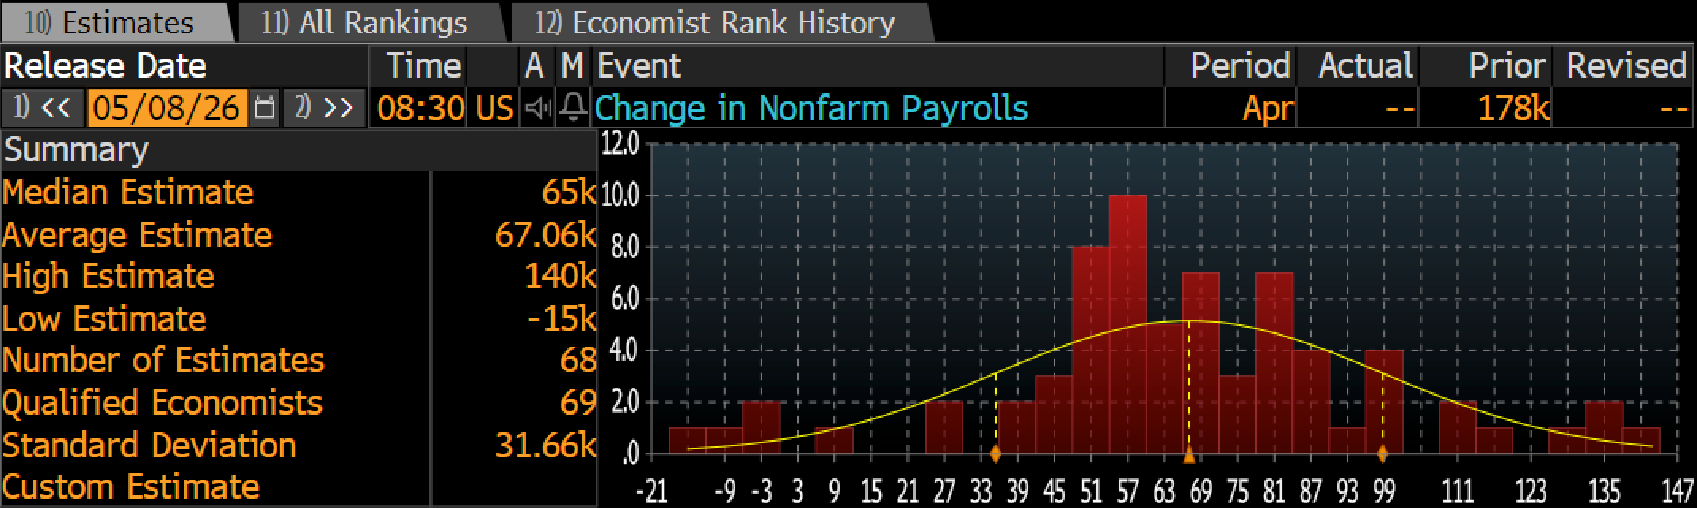
The median estimate points to a significant step down from the prior reading, with the range of economist forecasts wide enough to reflect genuine uncertainty rather than a consensus view.
The report lands at a moment when markets are increasingly attuned to two competing forces: the structural displacement of labor from AI adoption and the broader stagflation narrative that has been building in the background.
Prime Intelligence
The S&P 500 has reclaimed all-time highs. The financial media has a dozen explanations for it. Trade optimism, earnings resilience, labor market stability. Those things exist. But they don’t explain the velocity, the persistence, or the shape of this move. For that, you need data.
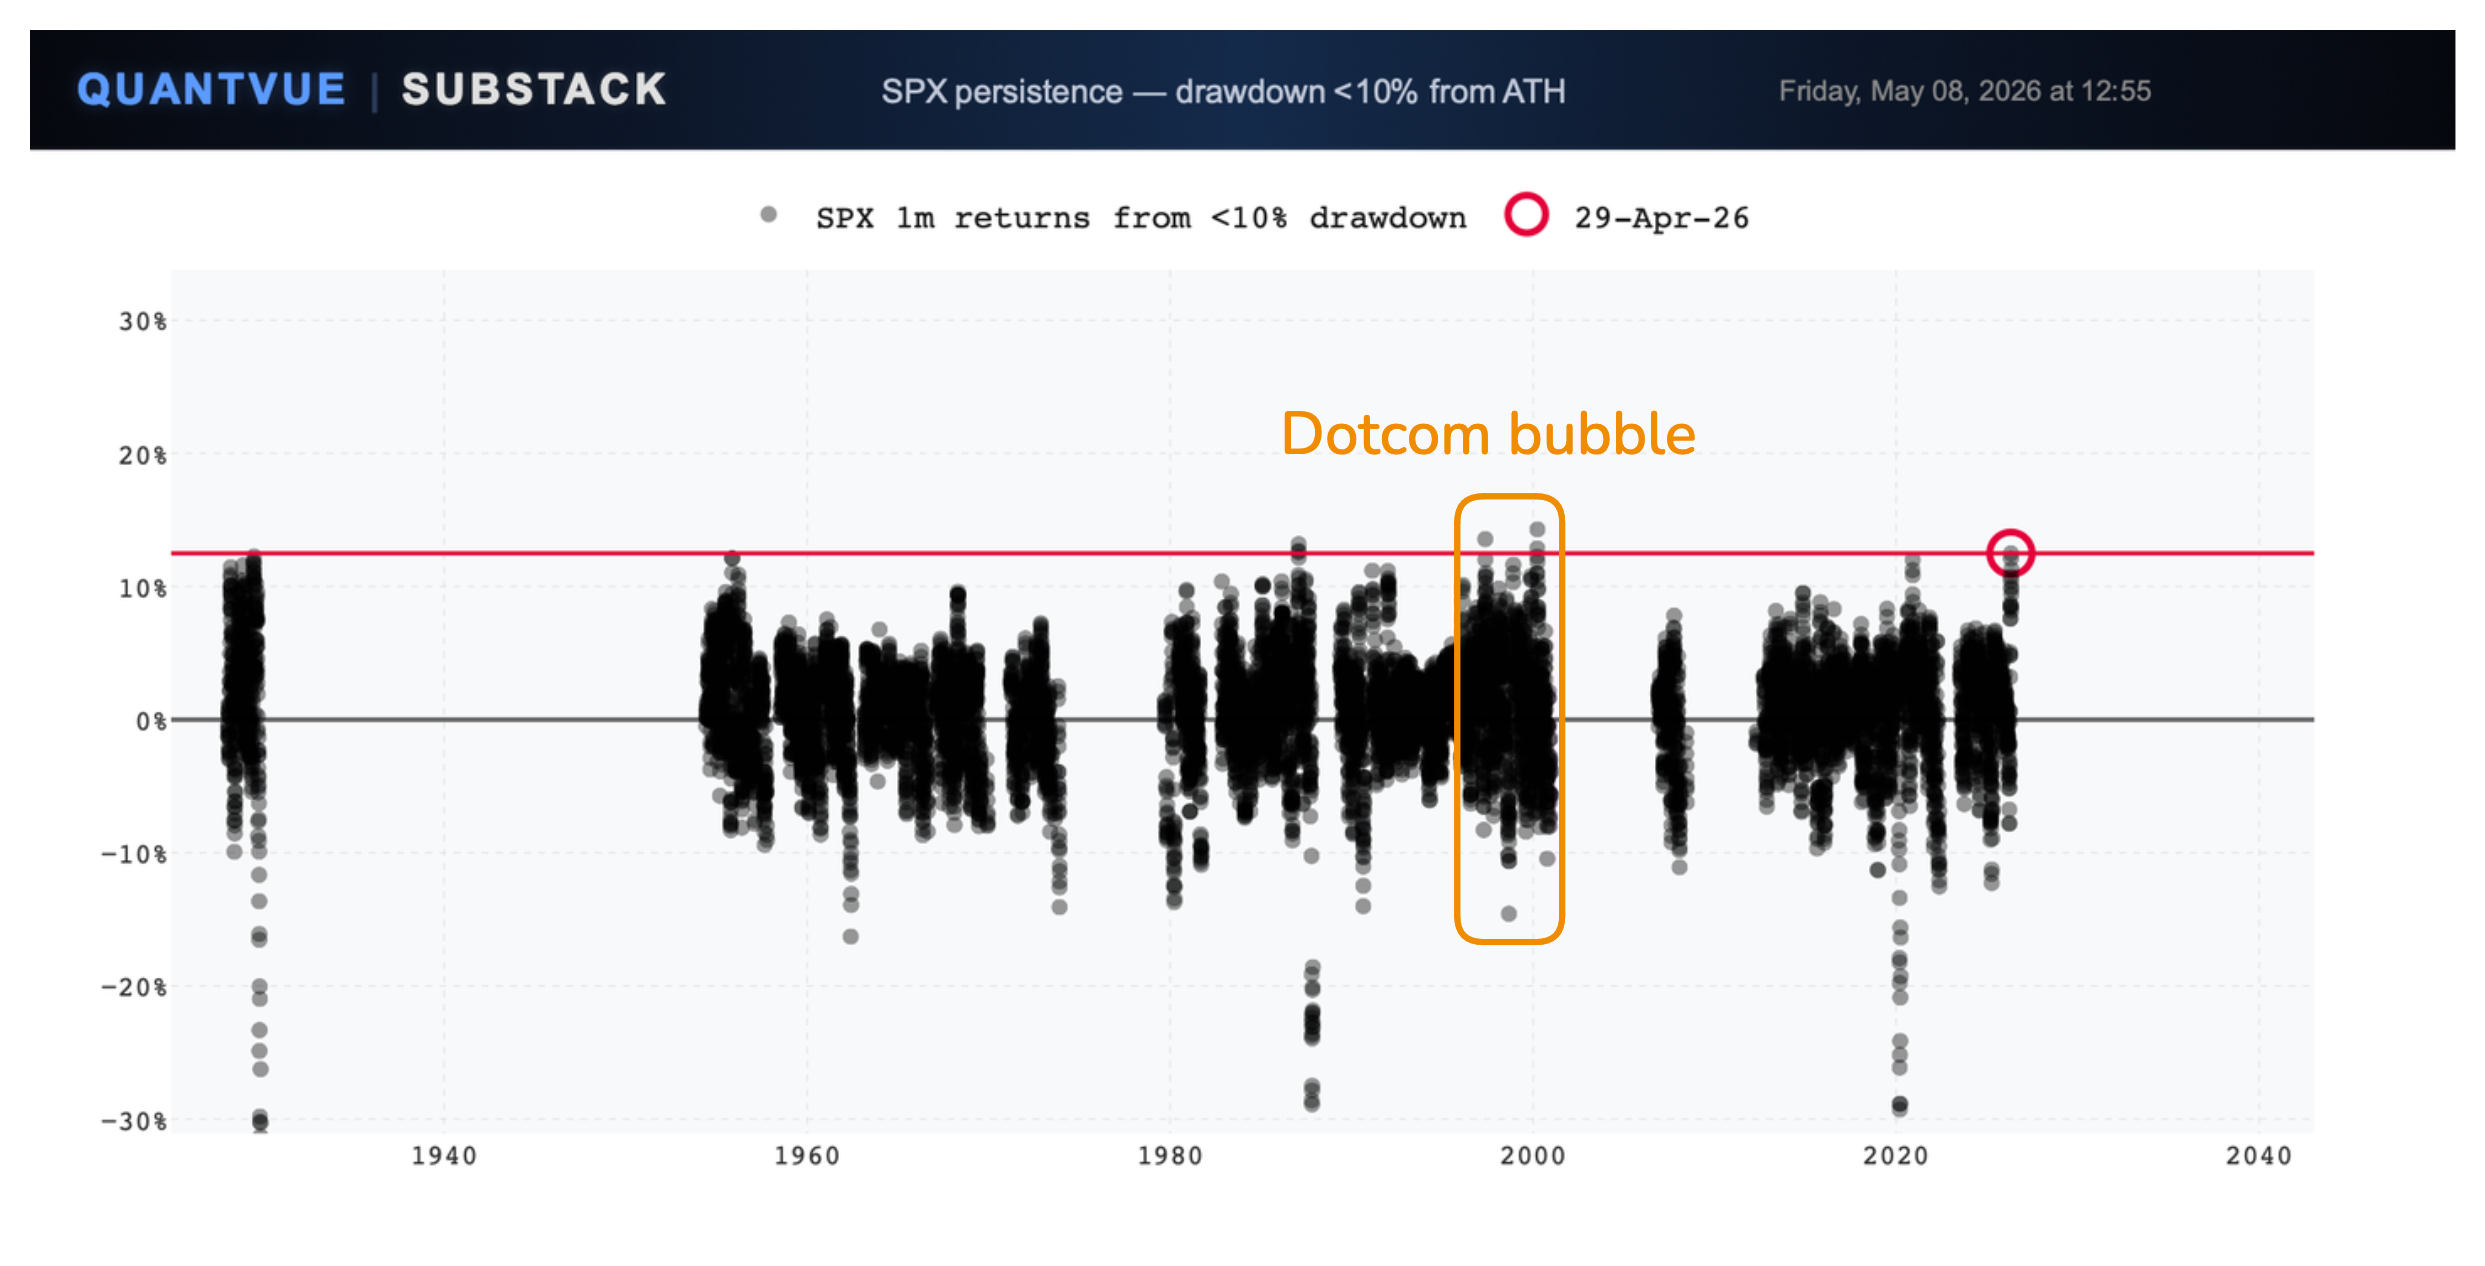
Persistence
Nearly 100 years of SPX returns off shallow drawdowns, and the current observation sits above almost all of them. The only comparable clusters belong to the Roaring 20s and the Dotcom bubble. This was not a deep drawdown followed by a relief rally. The market recovered from a relatively minor correction at a speed that is, by any historical measure, extreme.
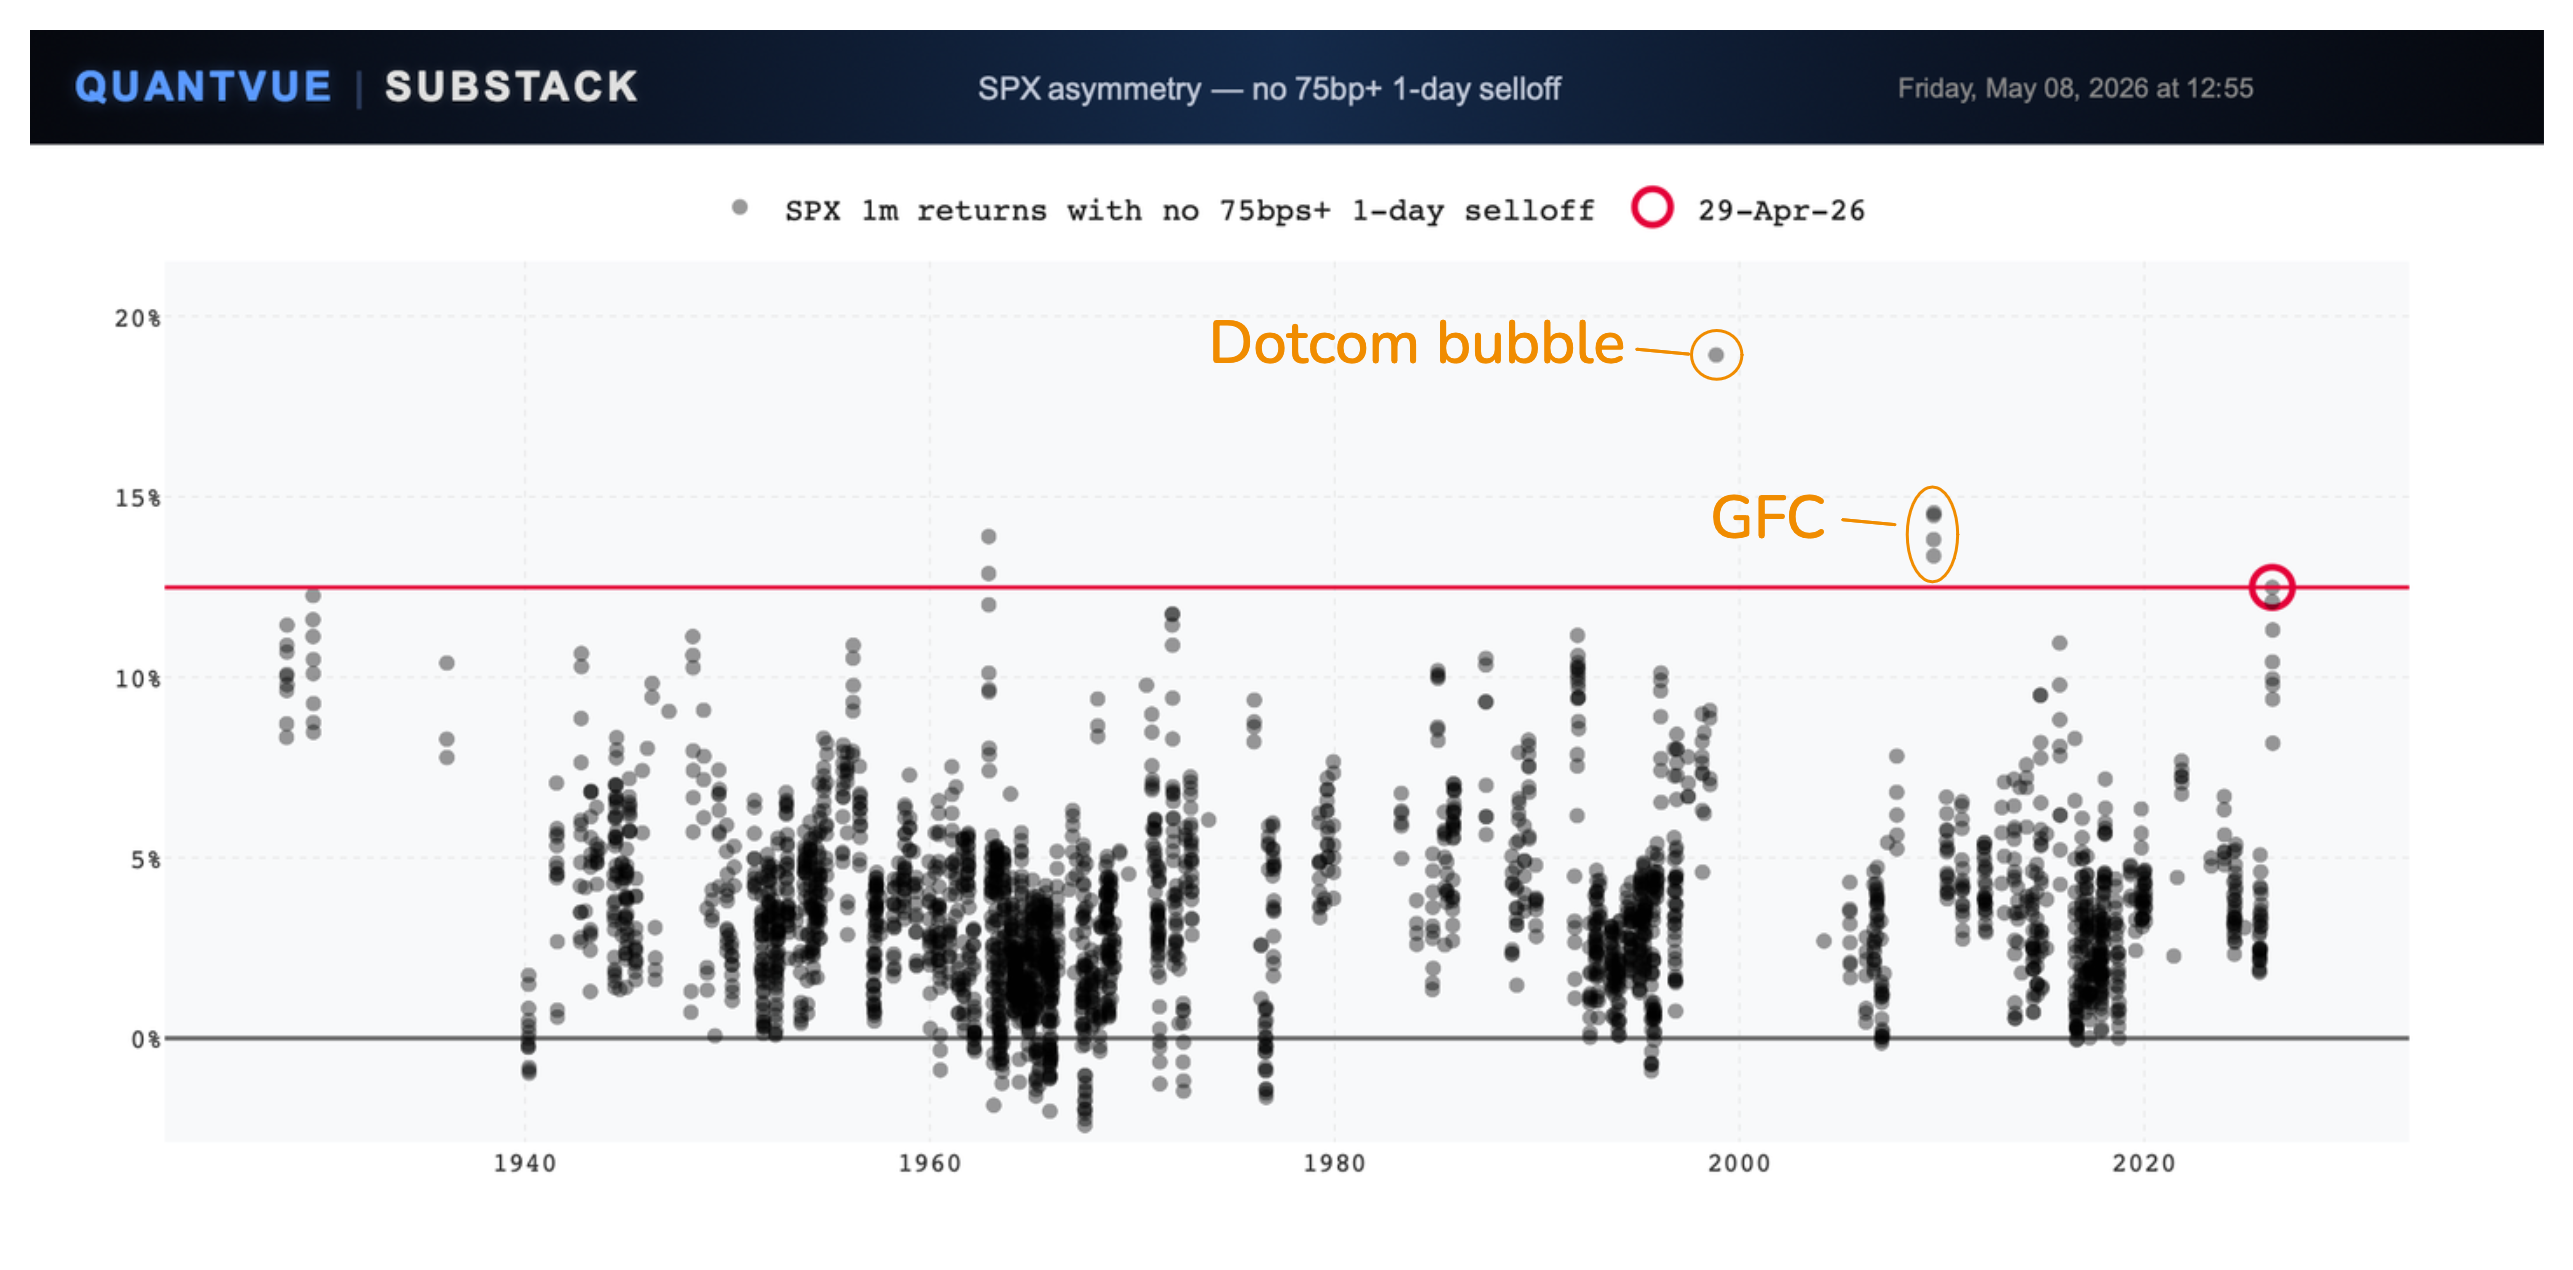
Asymmetry
The rally did not grind higher through a mix of big up days and big down days. There was not a single daily decline of 75bps or more across the entire move. That combination of magnitude and smoothness has only appeared twice in modern market history: the Dotcom bubble and the post-GFC recovery.
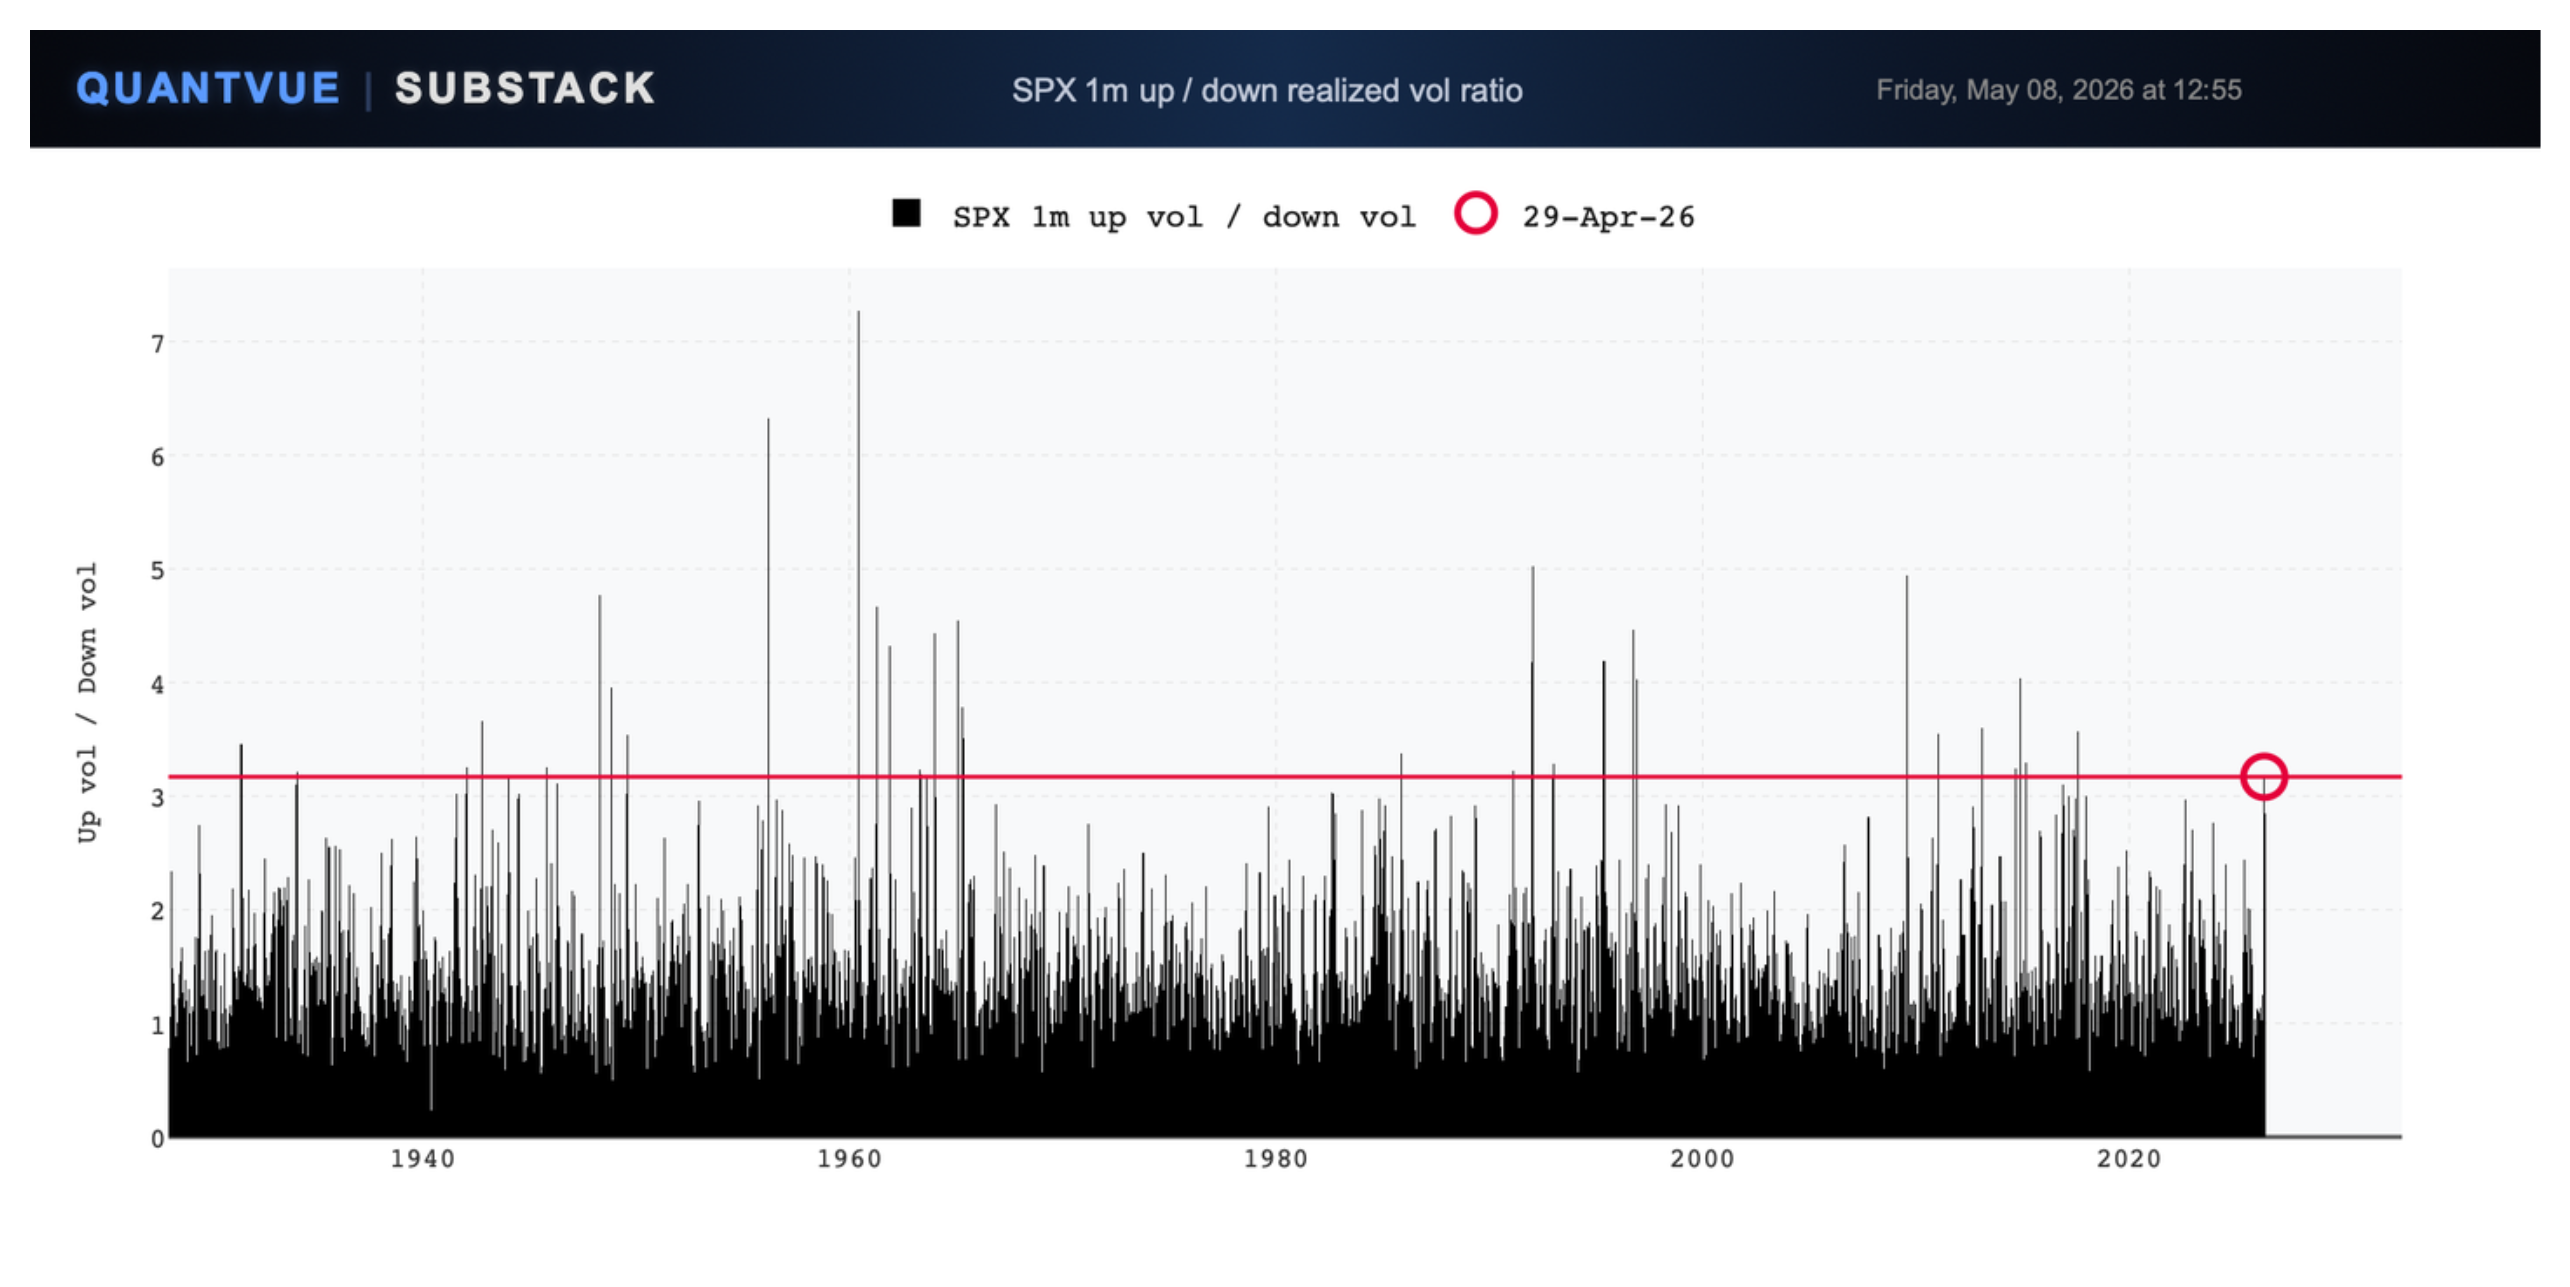
The Vol Signature
The up-vol to down-vol ratio over the past month sits above the 99th percentile since 1928. Upside realized volatility has been running at more than three times downside. The options market registered this, but only partially. Despite the flattening in put skew and the lift in call vols, implied vol is still underpricing the upside tail. The vol risk premium exists in the belly of the distribution, not the wings, and particularly not on the call side.
Key Takeaways: Three charts, three different lenses, one conclusion. The magnitude, persistence, and vol profile of this rally all rank near the 99th percentile going back nearly a century. The only historical analogs are the Roaring 20s, the Dotcom bubble, and select post-GFC windows. The mechanical bid is the most credible explanation. And the options market is still not fully pricing what that means for the upside tail.
The Market Brief
In today’s brief we break down how ten stocks drove nearly 70% of the S&P’s rally since March 30th, and why mutual funds were caught offside for all of it.
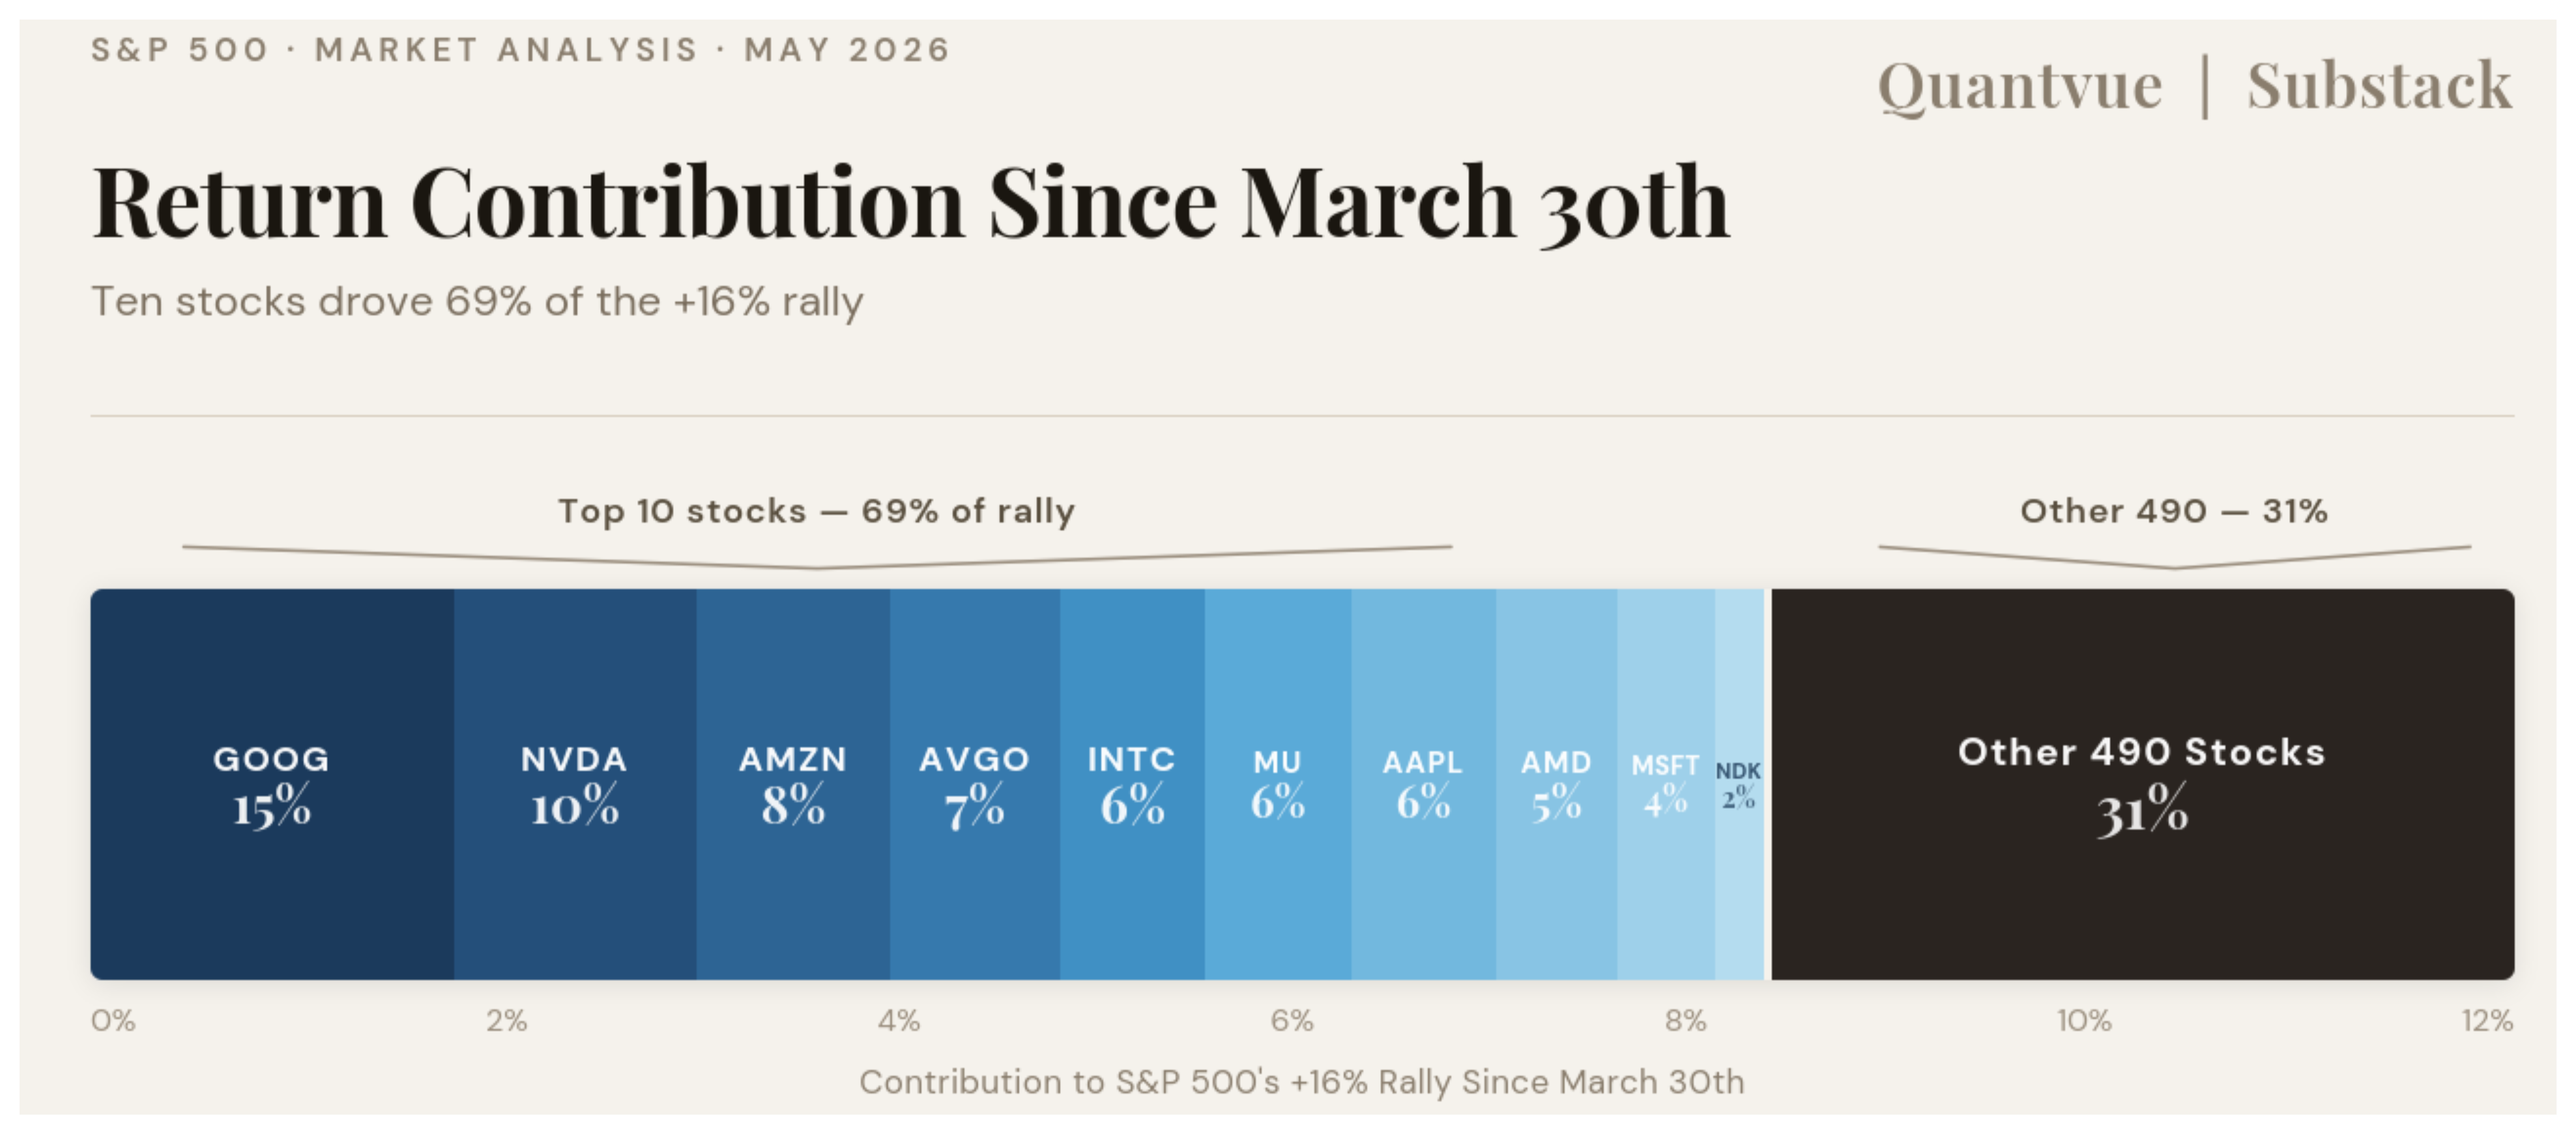
Subscribe to find out which names led the mechanical bid and whether there is still room to run. 👇