
Volatility Watchlist
US stocks fell notably on Friday with the S&P 500 down 2.4% for the week, as investors digest a very weak NFP report, geopolitical tensions, and a new set of tariffs unveiled by Trump.
Impact Snapshot
ISM Services PMI - Tuesday
10-Year Note Auction - Wednesday
Unemployment Claims - Thursday
Macro Viewpoint
Nonfarm payrolls rose by just 73,000 in July (expectation: 100,000+), while figures for May and June were revised down by a massive 258,000 jobs. To put this in context, it was the largest downward revision since the COVID era in 2020.
Following the disappointing report, Trump claimed the job numbers were being produced by a Biden appointee and called them "fake." He then proceeded to fire said person.
The twist is that these job revisions may be exactly what Trump needed to push Powell toward cutting interest rates.
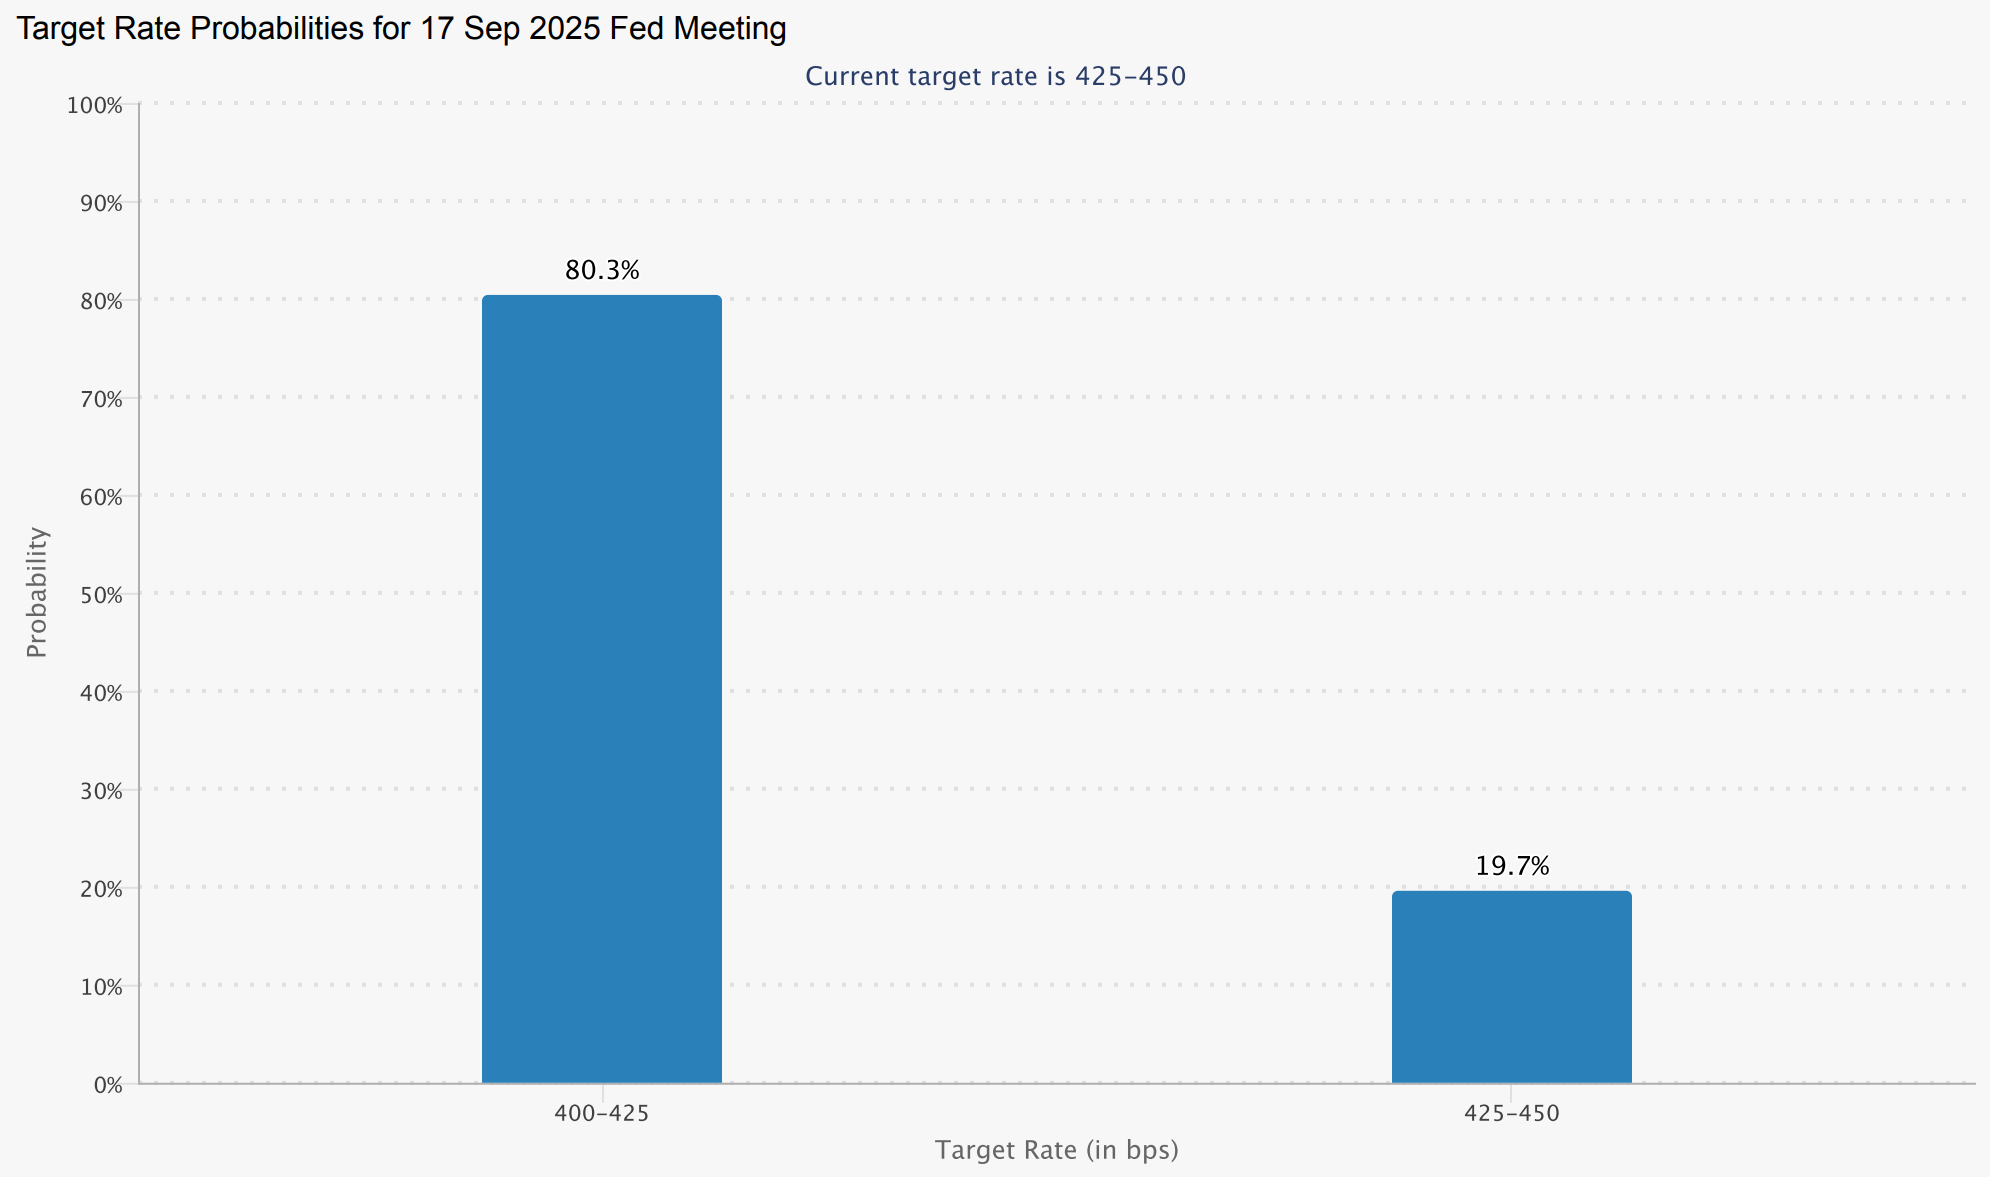
The Federal Reserve will only lower rates if inflation sustainably falls to its 2% target or if the labor market shows significant weakness. The downward revision of 258,000 jobs, combined with the weak July number, has actually increased the odds of a September rate cut to over 80%.
Tariff developments will remain in the spotlight over the coming days as the set of US tariffs will become payable on August 7. That keeps the door open for more agreements and adjustments next week.
Wall St. Prime Intel
DISCLAIMER: Investing and day trading are separate fields. We share insights from investment banking desks for informational purposes. Don’t let them solely influence your intraday trading decisions, as these opinions pertain to a longer time horizon.

Futures Sales Trading
As the S&P 500 closed out July +2.2%, marking the 3rd consecutive month of positive returns (3m return of +13.8%), institutional net length continued to grow.
Total institutional short positioning remains not far off from the post “liberation” day peak. Over the same time frame, institutional longs in VIX futures have accelerated meaningfully, reaching levels last seen in 2023.
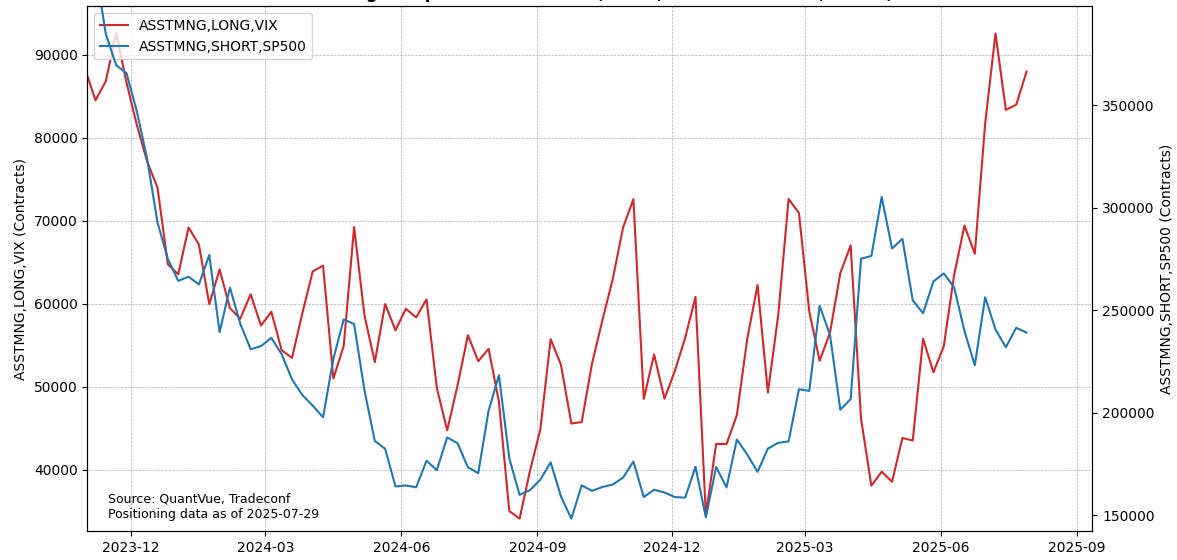
Thus flows exhibit some growing concerns around US economic growth and trade, which were perhaps vindicated by Trump’s recent actions and the disappointing payrolls print.
Systematic Trend Followers
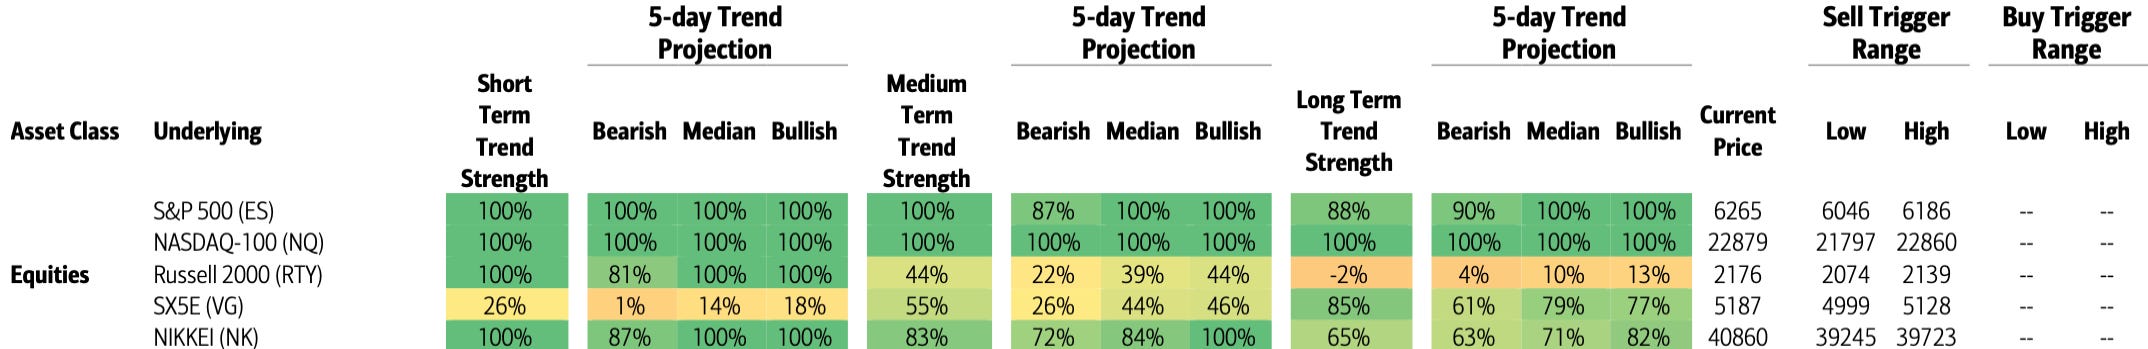
On Friday trend followers also took losses on long equity index positions across the globe. The declines in the S&P 500 and NASDAQ-100 leave CTA stop loss triggers closer with larger selling expected if the indices see a bearish price path.
Positioning is in consensus across the spectrum of trend followers, so unwind impact could be more felt.
Vulnerable
We believe the systematic strategy positioning is vulnerable as volatility, as showcased in multiple instances at the end of last month in our briefs, is expected to see a rise off the lows this month.
As trend signals continued to ramp up and vol fell over the last 3½ months, systematic strategies across the board raised exposure to elevated levels.
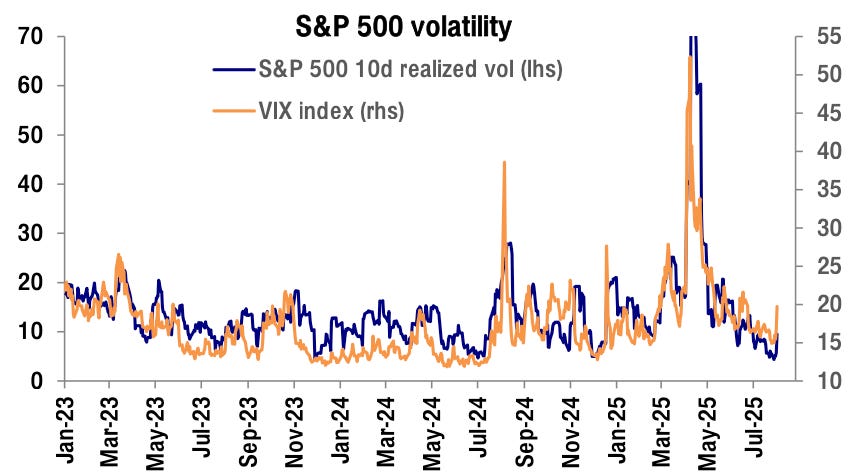
Implied vol fell as realized vol fell to near multi-year lows even as the vol premium was quite elevated.
Coming into last week, realized vol had arguably fallen too low considering the stage of the cycle and macro growth, which means institutional systematic strategy positioning is now vulnerable in the near term.
Pullback Scenarios
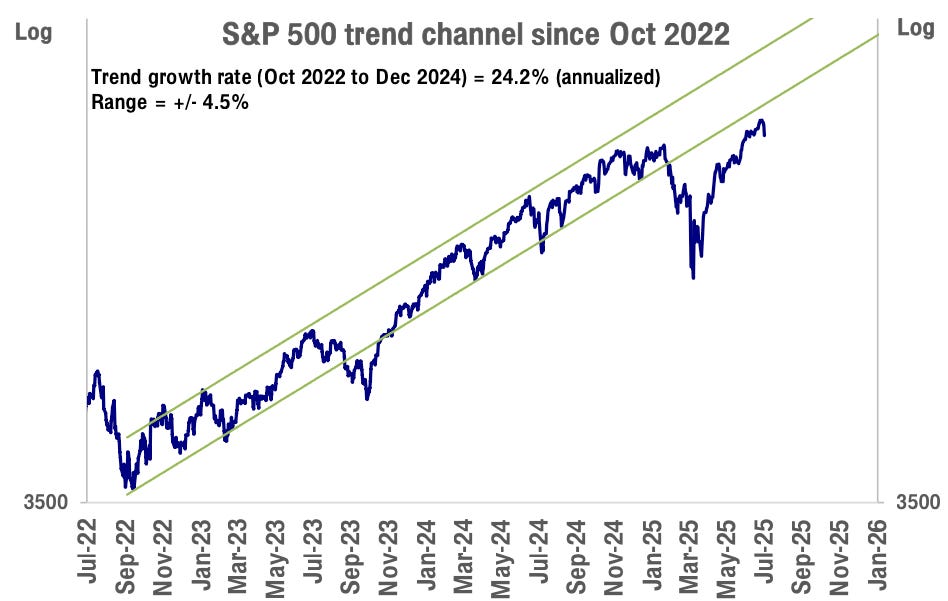
The rally off the April lows had seen the S&P 500 almost back within the prior steep trend channel in place since Oct 2022, which is in its third year rising at an eye-popping 24% annually.
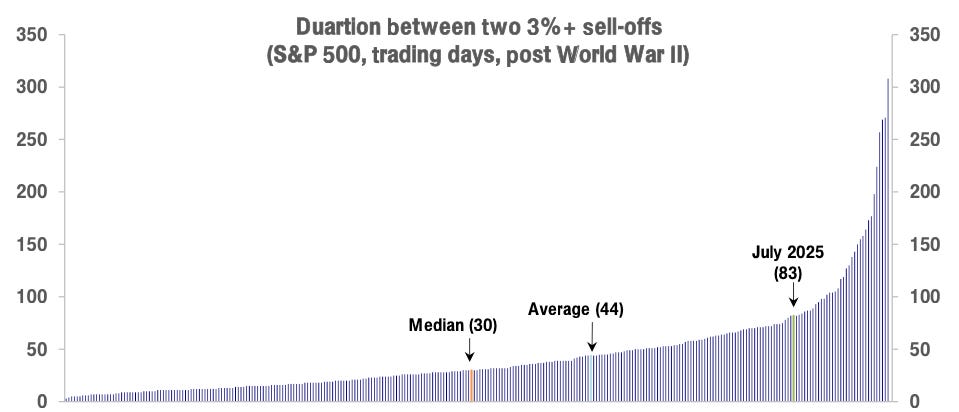
Historically, the S&P 500 has seen small pullbacks (over 3%) every 1.5 to 2 months on average. It’s been well over 3 months since the last one in April.
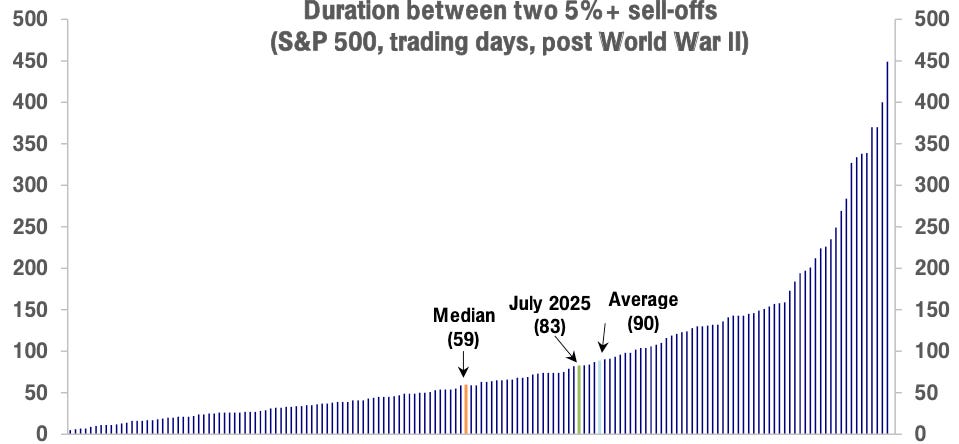
Somewhat larger pullbacks of 5% or more have occurred every 3 to 4 months on average historically. The S&P 500 is down about -2.5% from the highs earlier this week and it will not be a surprise if it pulls back a little more.
Do you want institutional intelligence delivered every morning into your inbox just like this? If you want access, consider becoming a paid subscriber. 👇

Disclaimer: Futures and options trading carries a significant level of risk and may lead to substantial financial losses. The content provided in this newsletter is solely for informational purposes and should not be construed as a trade recommendation or financial advice. It is essential for readers to independently assess and make their own investment decisions, taking into consideration their personal financial situation and risk tolerance.