Worst to Best
Last week, the S&P 500 completed its ninth straight weekly gain, adding 1.4% as stocks pushed to all-time highs on news of a tentative US-Iran ceasefire extension.
Impact Snapshot
ISM Manufacturing PMI - Monday
April JOLTS Job Openings data - Tuesday
ADP Non-Farm Employment Change - Wednesday
ISM Services PMI - Wednesday
Unemployment Claims - Thursday
May Jobs Report - Friday
Macro Viewpoint
The S&P 500 rose for a ninth straight week, adding 1.4% on the week and 5% for May, as investors continued to climb a wall of worry spanning tech valuations, macro uncertainty, and geopolitical risk, all on the back of strong earnings growth.
Fear is being stripped from this market. The VIX hit its lowest level since January and vol-of-vol is at its most depressed reading of the year. Beneath the calm surface, however, the funding market told a different story.
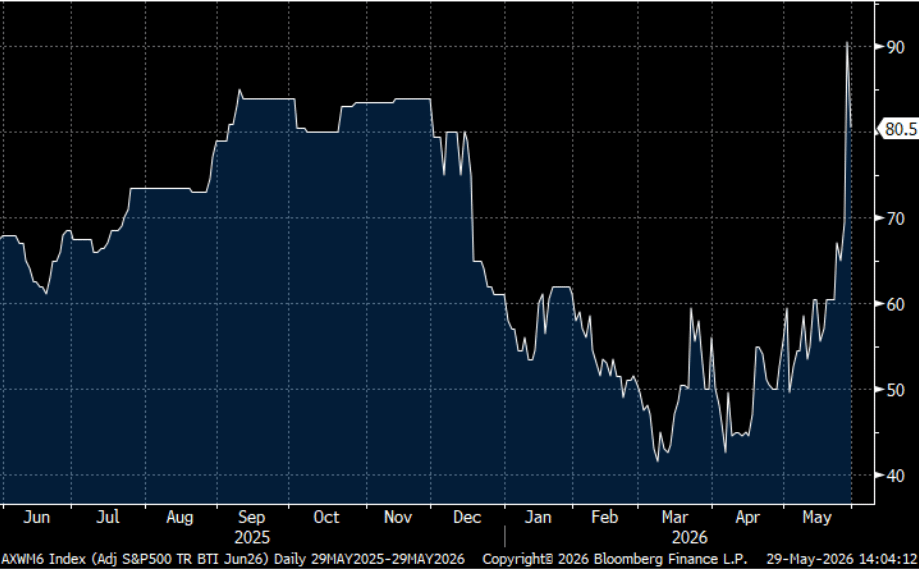
The cost for institutions to hold leveraged S&P 500 exposure spiked to its highest level in over a year this week, reflecting a crowded trade: hedge funds at elevated gross exposure, leveraged ETFs mechanically adding risk as prices rise, and month-end balance sheet pressure all hitting simultaneously. The recent rally has been leverage-driven, and stretched positioning like this unwinds fast.
Prime Intelligence
The S&P 500’s response to the Iran war has shifted from one of the worst on record following a geopolitical shock to one of the best.
In March, we outlined the historical playbook: an initial selloff of 6–8%, a trough on average within three weeks, and a full recovery in the three weeks after, typically well before the underlying conflict is resolved.

By the end of March, the drawdown had placed the market in the bottom decile of all geopolitical shock responses since 1939, pricing in one of the worst outcomes ever observed.
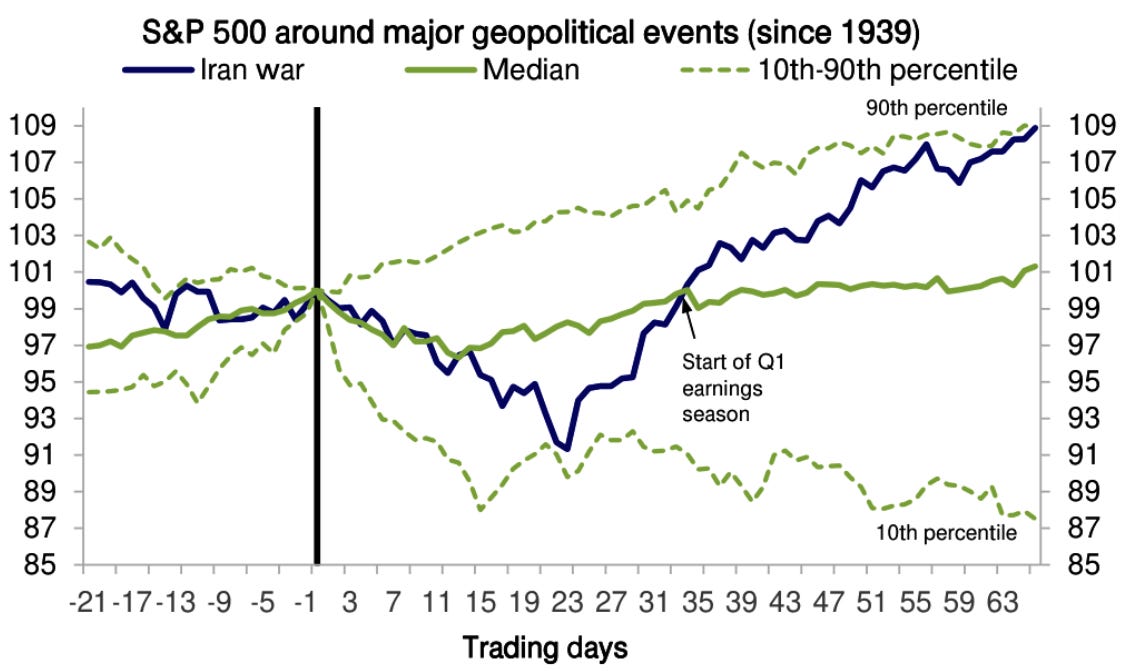
The subsequent rally has moved the market to the opposite extreme, now sitting in the top decile. From here, further progress on the conflict is unlikely to serve as a meaningful additional upward catalyst for broad equities. It is, however, likely to drive rotation into sectors and regions that have lagged.
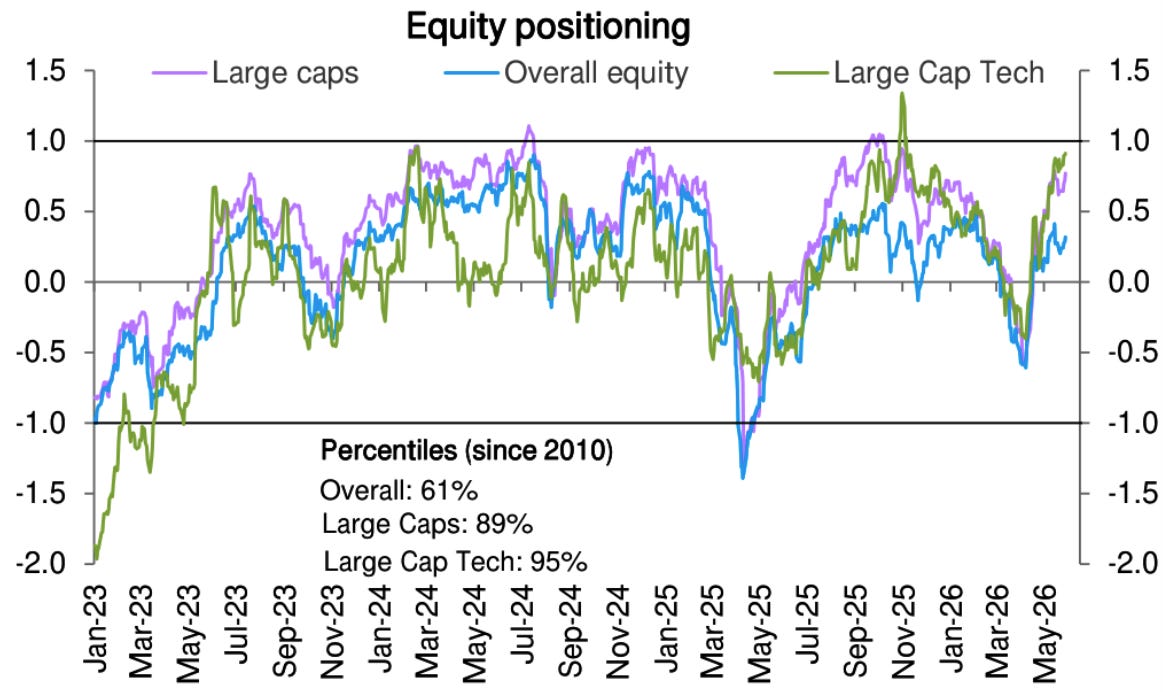
Positioning reinforces this view. Overall equity exposure remains modestly overweight, at the 61st percentile since 2010. Large-cap positioning is more elevated at the 89th percentile, while large-cap tech sits at the 95th percentile, levels consistent with limited room for further multiple expansion in that segment.
Key Takeaway: The market has fully repriced the Iran war shock, moving from the bottom to the top decile in a matter of weeks, in line with the historical geopolitical playbook. With broad equity upside becoming more constrained, the focus shifts to rotation, where stretched positioning in large-cap tech stands out as the clearest imbalance to watch.
The Market Brief
In today’s brief we break down the systematic flow picture heading into the next week, and what the positioning math means if markets turn. We also cover where discretionary money is moving, and why the earnings story still has room to run.
Join hundreds of subscribers already on the inside 👇